The MSCI All Country World Index has gone 159 days without a 5% pullback. That is the 3rd-longest stretch since 2008.
Here’s the chart:
Let's break down what the chart shows:
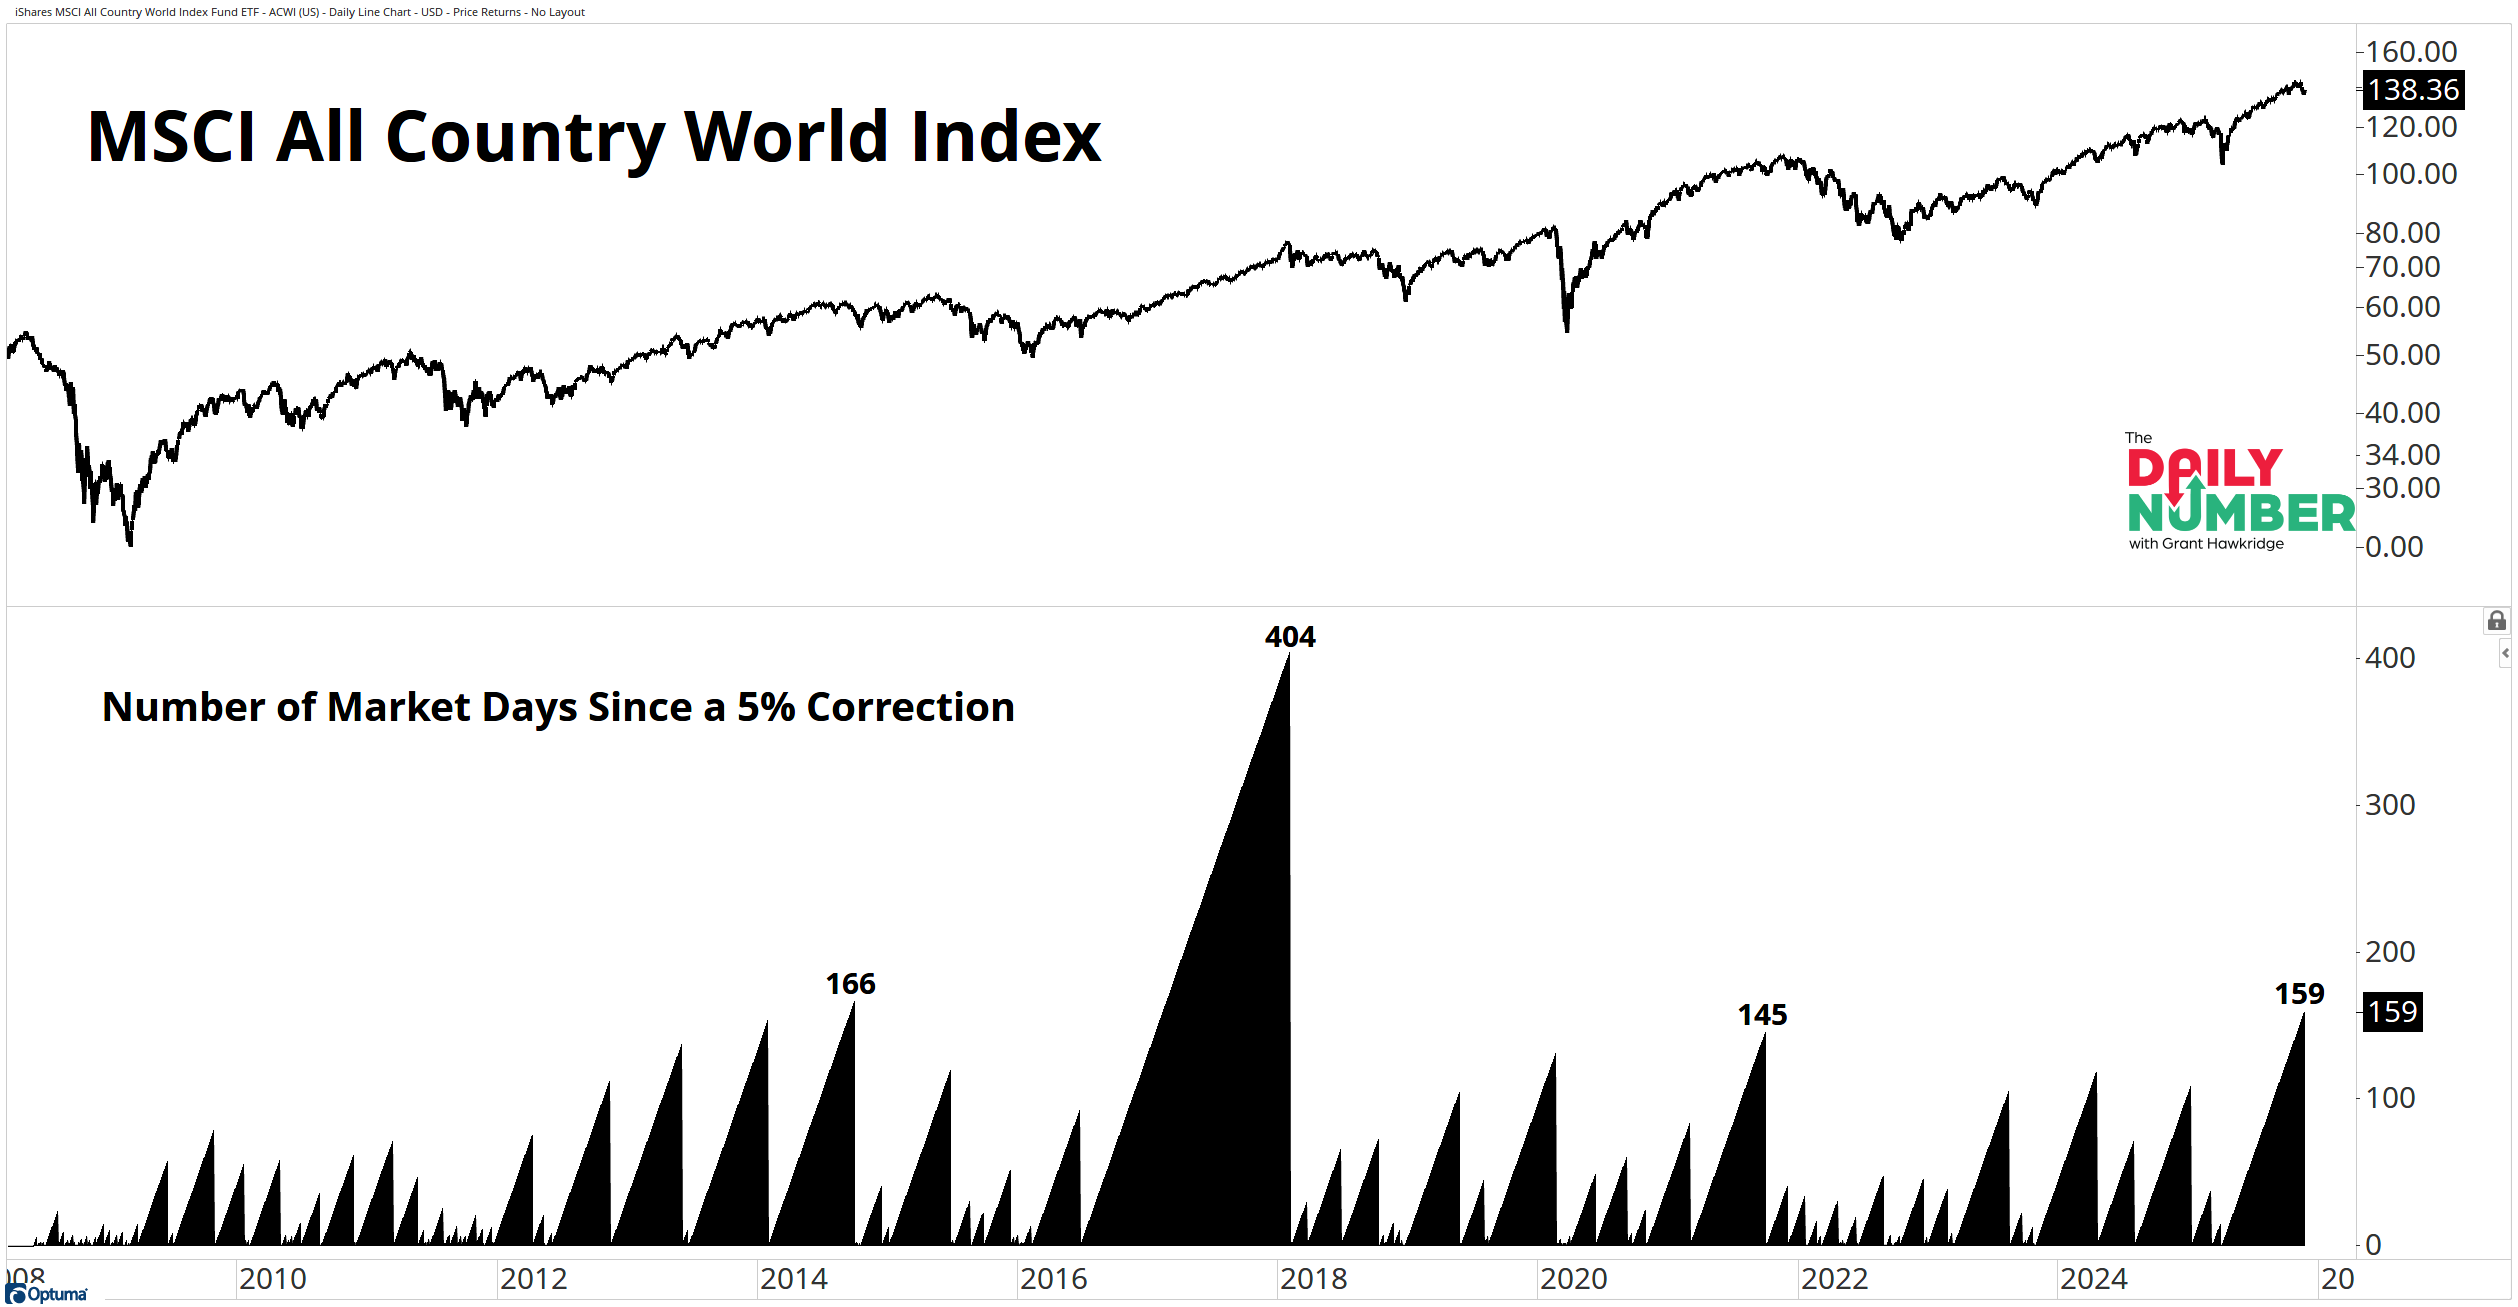
The top panel displays the MSCI All Country World Index price in black.
The lower panel displays a series of rising black spikes that count market days since the last 5% correction.
The Takeaway: This move now sits inside the top tier of uninterrupted global advances.
Only two runs have lasted longer.
One stretched to 404 days in 2016–2018. Another hit 166 days in 2014. That puts today’s 159-day count in rare territory.
A streak this long says the trend has been strong.
Buyers have stepped in every time price softened.
Global participation stayed wide. Pullbacks stayed shallow. That is the kind of tape that carries bull markets higher.
But this kind of stretch does not last forever. The longer the market goes without a reset, the more energy builds. When that reset gets delayed, digestion becomes more likely.
159 days is a long stretch without a break. Runs like this usually hand the market a cooling period at some point, and that is where the next phase starts.
So, does this streak push even higher, or do we finally get the pullback global markets have avoided for 159 days?
If you find my content valuable, I would greatly appreciate it if you could share it with your friends, family, and colleagues. Your help in spreading the word is invaluable in supporting our work. Thank you to all of you who share!