The 5-day moving average window just lit up across the market. Every major index now sits near the top of its short-term breadth curve after a sharp reset.
Here’s the chart:
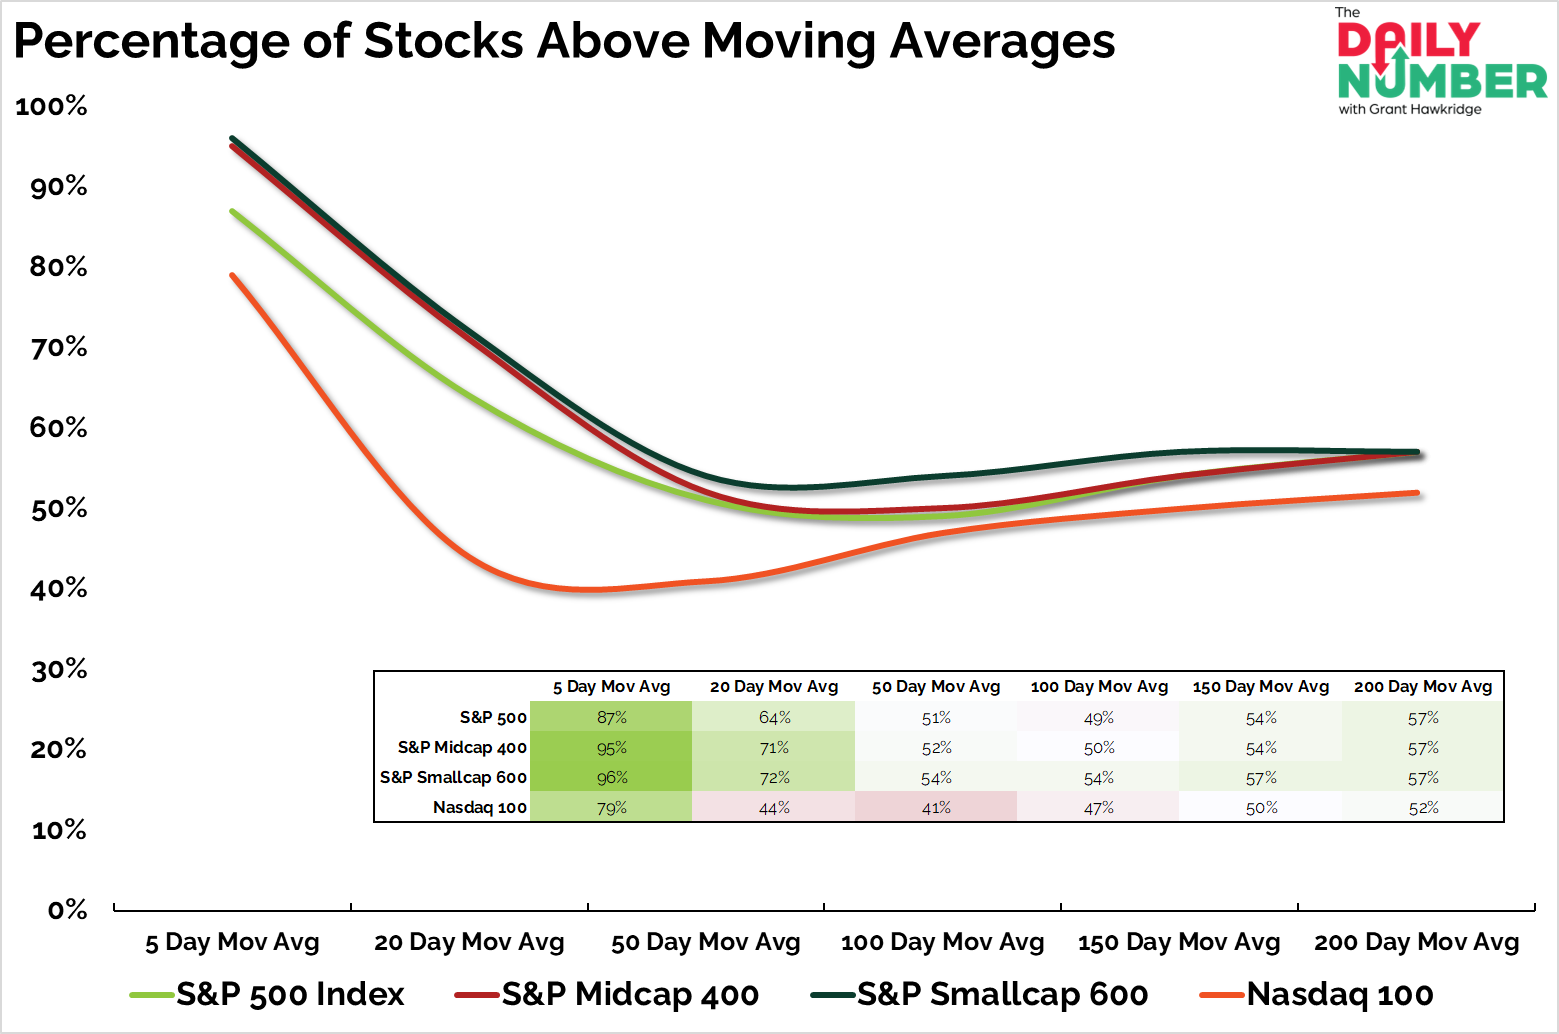
Let's break down what the chart shows:
Four colored lines display the percentage of stocks above six different moving averages.
The green line tracks the S&P 500.
The red line tracks the S&P Midcap 400.
The dark green line tracks the S&P Smallcap 600.
The orange line tracks the Nasdaq 100.
The table below the lines displays the exact percentages for each index at each moving-average window.
The Takeaway: Short-term breadth snapped back fast.
All four indices sit near the top of their 5-day readings.
The S&P 500 sits at 87%. The S&P 400 sits at 95%. The S&P 600 sits at 96%. The Nasdaq 100 sits at 79%.
That is what you see when buyers come in together.
Over the past 3 days, the S&P 500 has jumped 3.5%. The S&P 400 ripped 5.3%. The S&P 600 exploded 7.2%. The Nasdaq 100 gained 4.0%.
These are the strongest 3-day runs since early 2025 for most indexes. Small caps posted their best burst since November 2024.
However, the curve’s shape tells you the bounce is young.
The drop from the 5-day to the 20-day is still sharp across all indices. That leaves room for the intermediate windows to play catch-up if buyers keep pressing.
Short-term breadth fired. The middle of the curve still lags. The 20-day and 50-day windows sit at the decision point. If they turn up, the bounce turns into a trend. If they stall, the bounce could fade fast.
If you find my content valuable, I would greatly appreciate it if you could share it with your friends, family, and colleagues. Your help in spreading the word is invaluable in supporting our work. Thank you to all of you who share!