It is the 12th month, and history shows December leans positive more often than not.
Here’s the chart:
Let's break down what the chart shows:
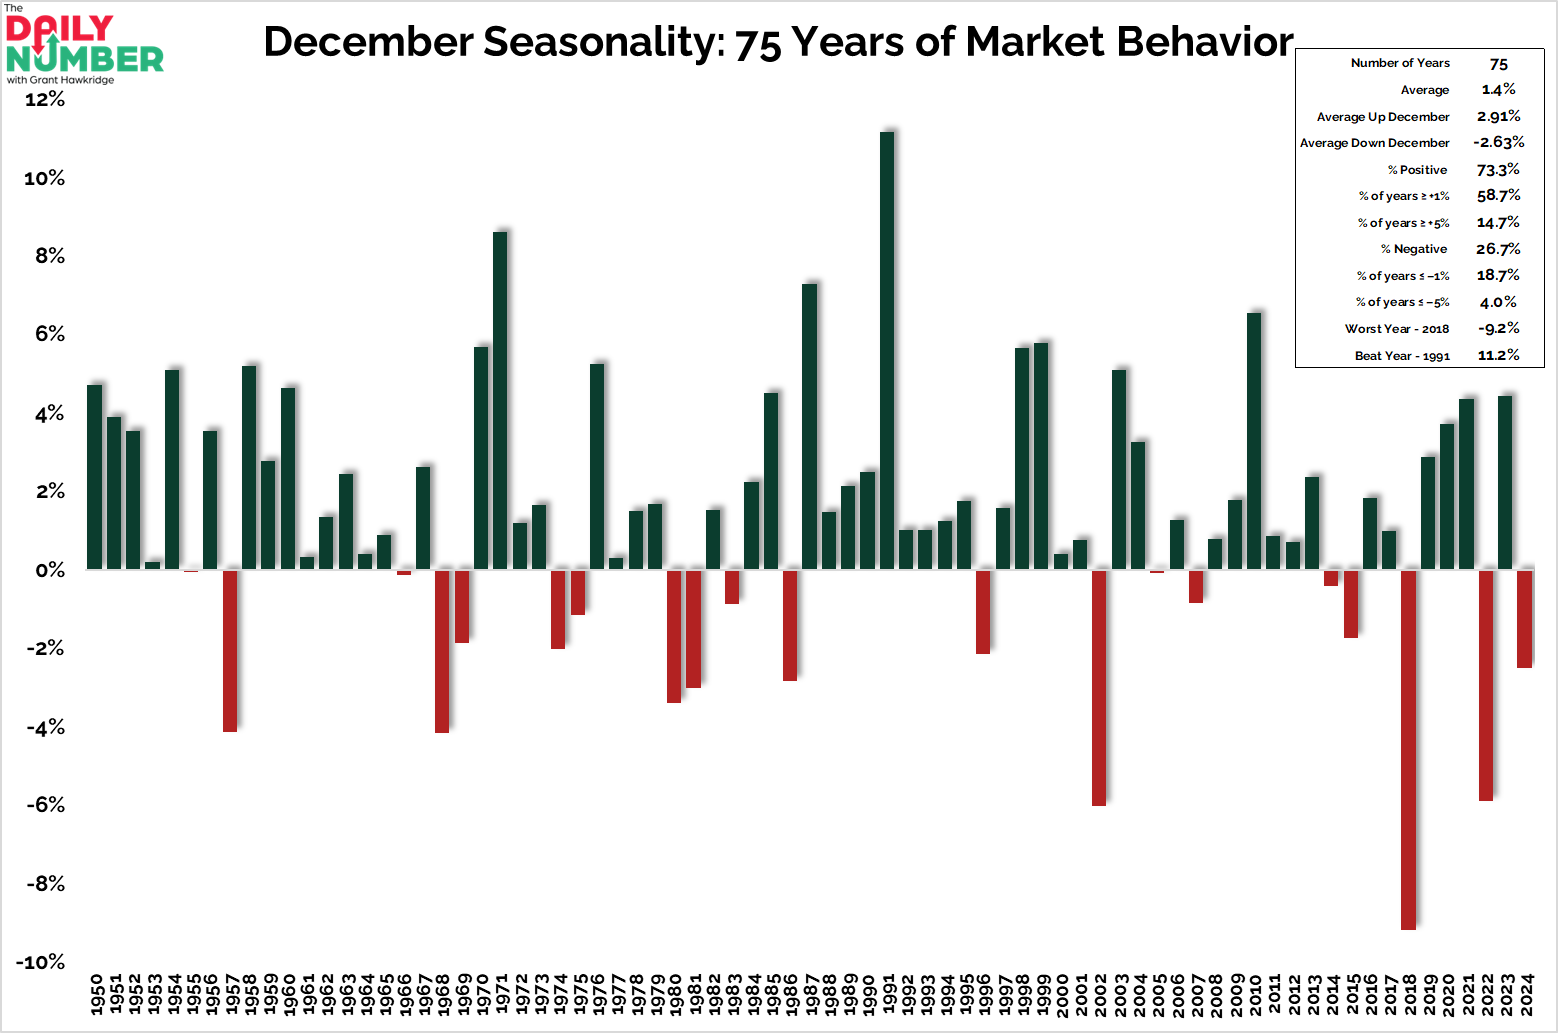
The chart plots December returns for the past 75 years.
Green bars mark positive Decembers and red bars mark negative ones.
The right panel lists the key stats, including the hit rate, average gains and losses, and extreme years.
The Takeaway: December leans higher more often than not.
December has delivered an average return of 1.4% across 75 years.
That places it near the top of the seasonal cycle, making it one of the better months of the year.
When December is up, it climbs with conviction. It has finished positive 73.3% of the time, and the average gain in those years is 2.9%. That is strong upside for a single month and shows how often buyers stay in control.
Down years are less common. Only 26.7% of Decembers have finished red, and the average down month is 2.6%. The negative side of the curve exists, but it plays a smaller role in the long record.
However, seasonality is not a trading system. It is context.
I treat it as second-tier data because it helps describe the backdrop, not a trading signal. The first tier is always the same. Price, trend, and how the tape behaves in real time. That is where conviction comes from.
Seasonality can support the idea, but it never drives the trade.
When the trend is strong, seasonality can add a tailwind. When the trend is weak, seasonality does not usually save it.
Now the market has a choice. Does this December drive the current bull market trend forward, or does it break the pattern?
If you find my content valuable, I would greatly appreciate it if you could share it with your friends, family, and colleagues. Your help in spreading the word is invaluable in supporting our work. Thank you to all of you who share!