In December, history shows the market’s strength tends to show up after mid-month, not before, and we are entering that window now.
Here’s the chart:
Let's break down what the chart shows:
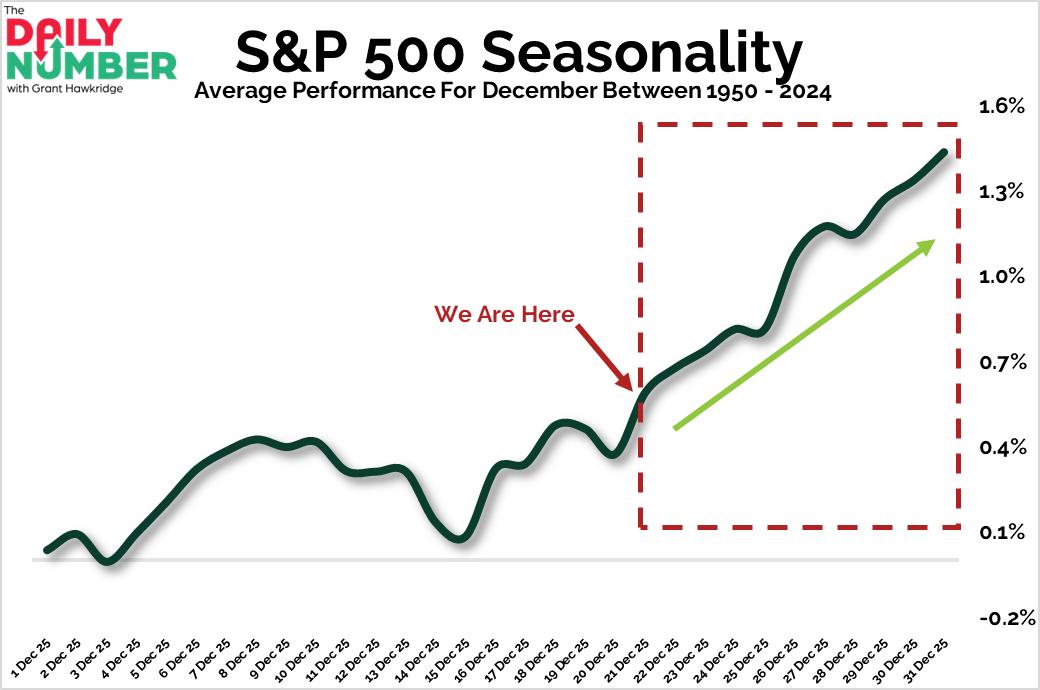
The chart shows the average performance of the S&P 500 during December from 1950 through 2024 as a dark green line.
The Takeaway: The back half of December is where markets have historically moved higher, not the front, which is why early-month chop has often given way to a late-month rip higher for stocks.
So far this December, the S&P 500 is down –0.2%. Price has spent the month digesting rather than lifting, which is normal for the front half of the month.
This late-month window we are about to enter also includes the Santa Claus Rally, which runs from the last five trading days of December through the first two of January, and that stretch begins on Wednesday. When buyers step in during this period, they tend to do it together, and price has historically moved higher.
Seasonality does not force a move higher, but when price is already holding above key levels, this stretch has rewarded staying with strength rather than fading it.
But a weak response in this window is valuable information for us. When December fails to lift, weakness often carries into January and can linger beyond it.
So, if strength does not show up here, how should risk be treated heading into January?
If you find my content valuable, I would greatly appreciate it if you could share it with your friends, family, and colleagues. Your help in spreading the word is invaluable in supporting our work. Thank you to all of you who share!