2026 Isn’t a Straight Line. Most Miss This Part. 📅
By Grant Hawkridge
January 5, 2026
Today's number is... 2026
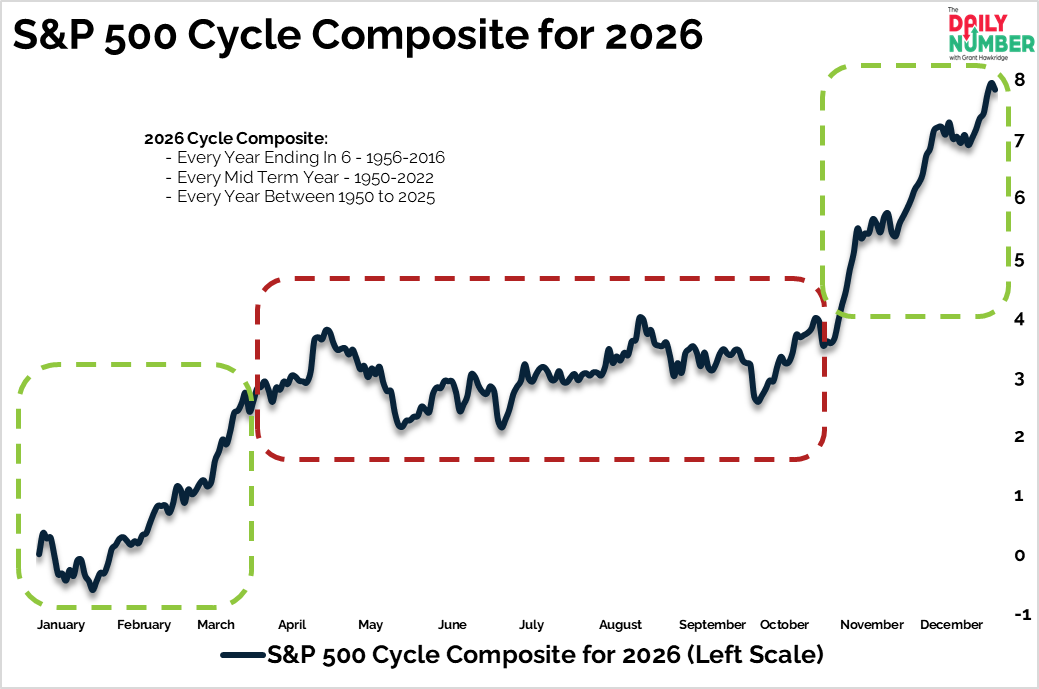
This is the S&P 500 composite cycle for the calendar year 2026.
Here’s the chart:
Let's break down what the chart shows:
The chart displays a dark blue line representing the S&P 500 composite path for 2026, from January through December.
The Takeaway: This composite combines every year ending in 6, every midterm year, and all years from 1950 to 2025. It builds an average path for the S&P 500 in 2026.
Early-year strength usually follows strong post-election years, with momentum carrying into the new calendar. Q1 is where that follow-through often shows up, as bulls stay engaged and pullbacks remain contained. The market tends to push higher before weakness starts to surface.
Q2 and Q3 are where progress usually slows and the average trend starts to struggle. Rallies fade, pullbacks interrupt momentum, and net gains flatten or slip. This is the stretch that wears traders down and starts to unwind positioning built earlier in the year.
As the grind drags on, the market stops rewarding and starts testing patience instead. Timing gets harder and mistakes get more expensive, which is where frustration builds and conviction thins out.
After months of that frustration, the shift usually shows up at the start of Q4. Bulls regain control and upside begins to stick again.
This cycle does not tell you what will happen. It is an average, a map built from past cycles, not a market forecast. It lays out a rhythm that shows up again and again. Early strength, a mid-year grind, and a late push.
The question on my mind is what the grind becomes this time. Is it just patience being tested, or does price need to reset more than most expect?
If you find my content valuable, I would greatly appreciate it if you could share it with your friends, family, and colleagues. Your help in spreading the word is invaluable in supporting our work. Thank you to all of you who share!