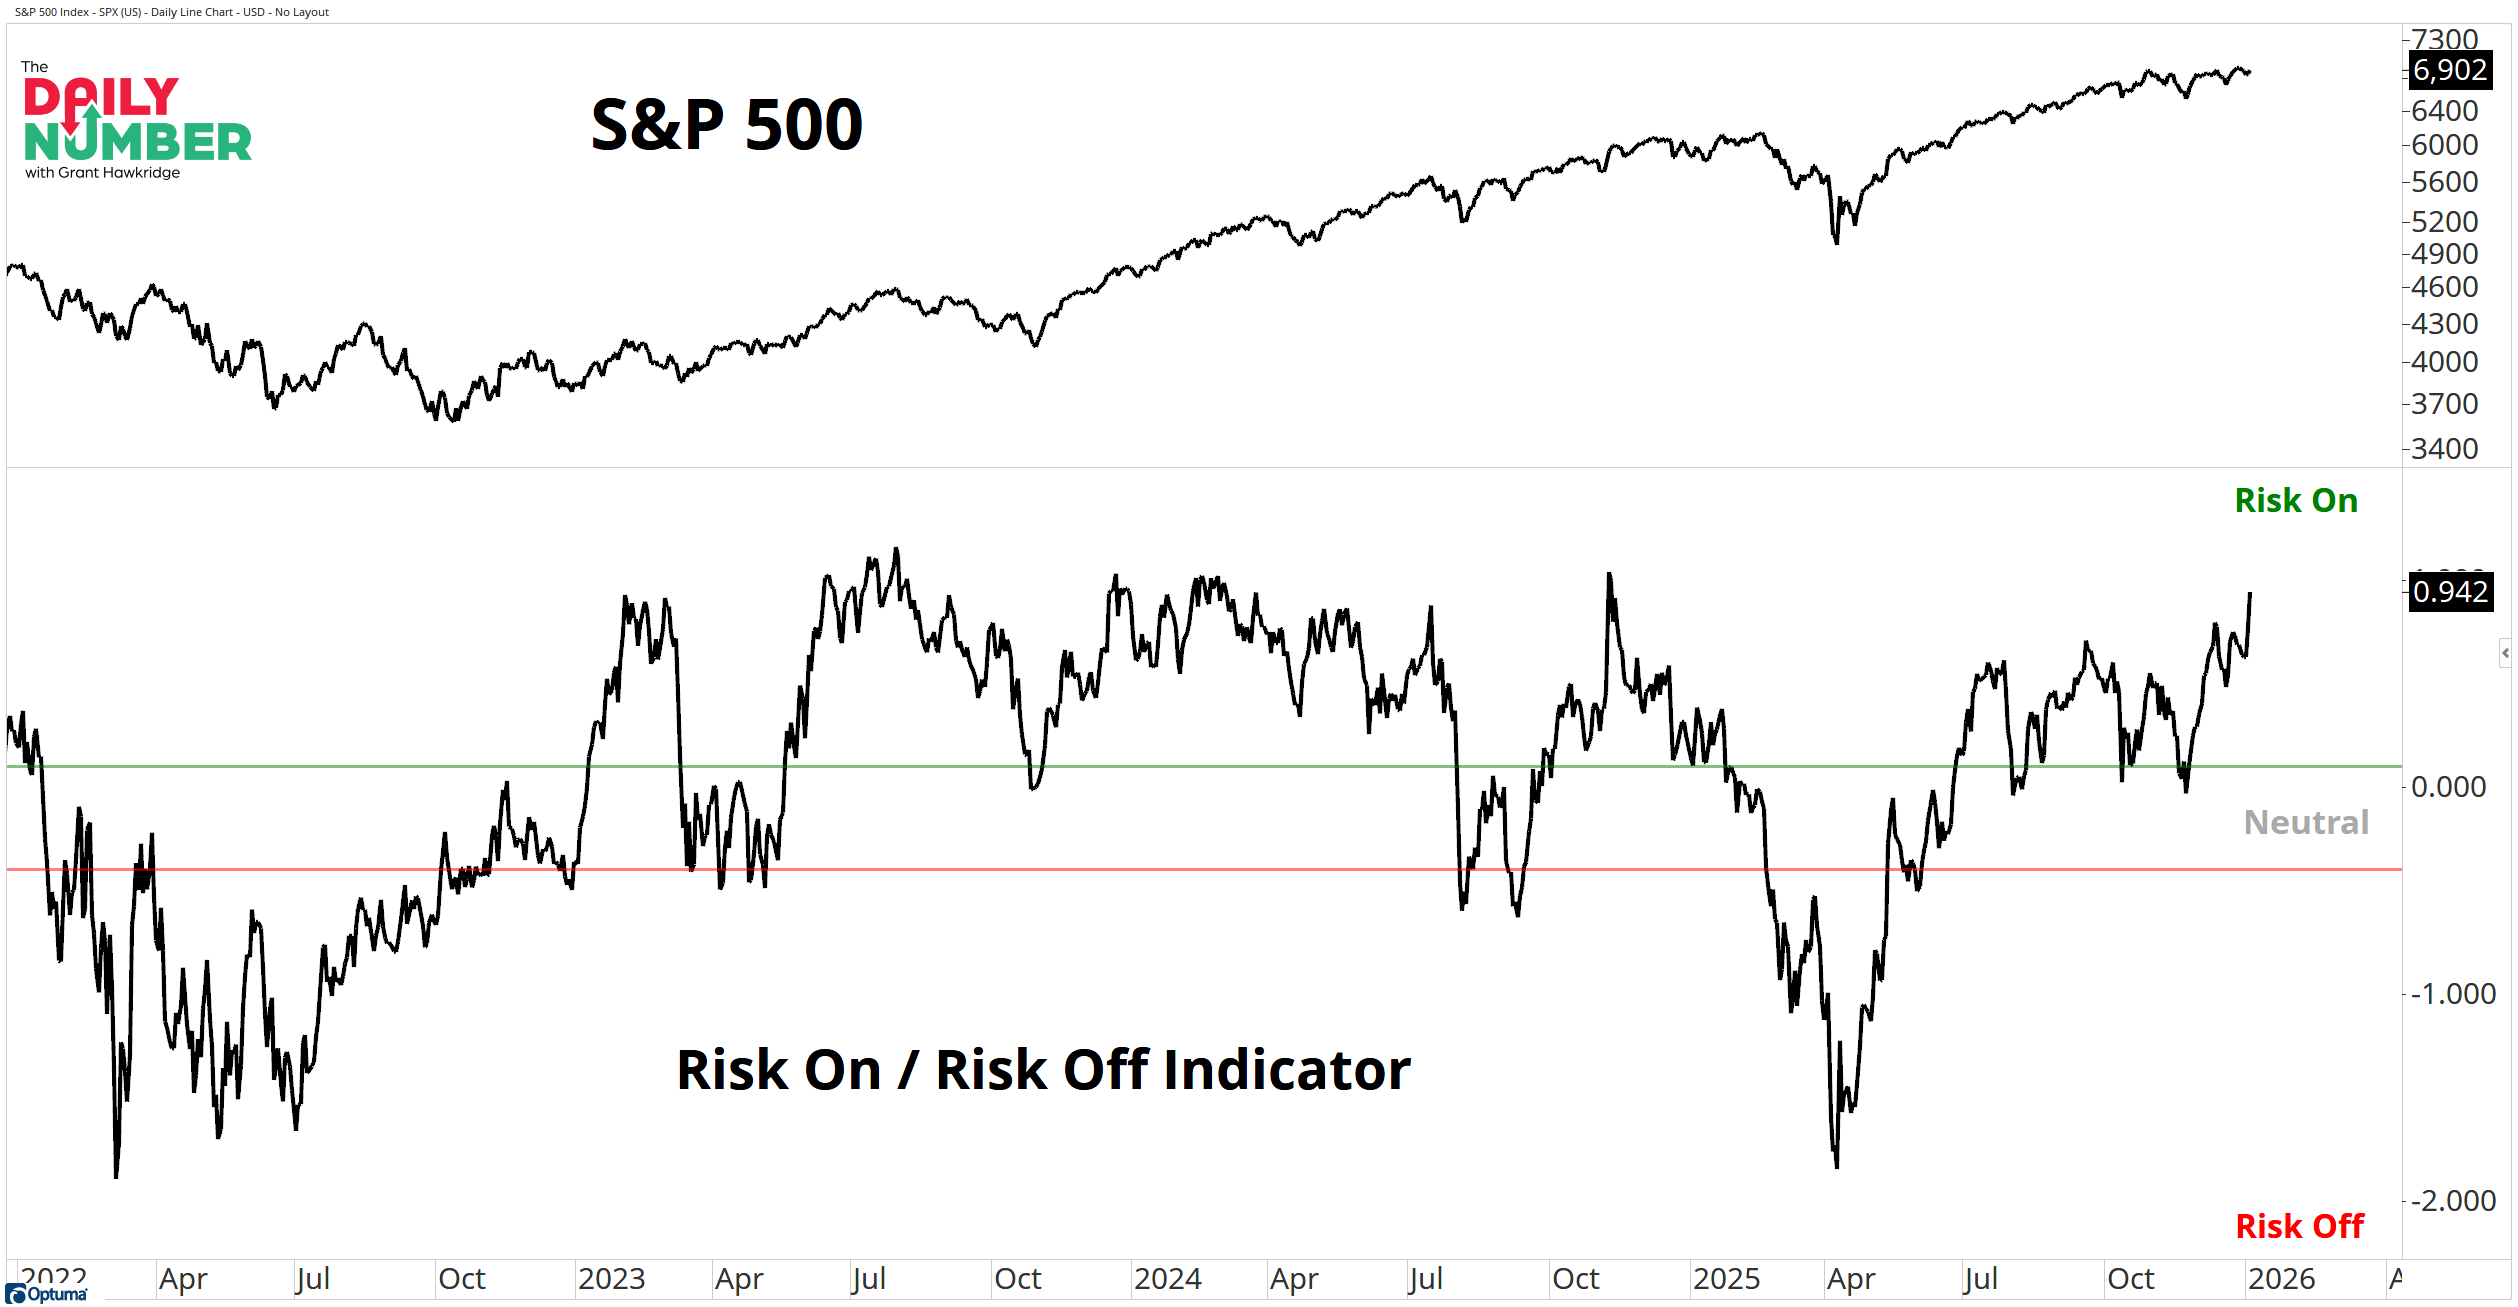
My Risk-On Risk-Off Indicator stands at 0.9, its highest level since early November 2024.
Here’s the chart:
Let's break down what the chart shows:
The chart displays the S&P 500 price line in black in the top panel.
The lower panel shows the Risk-On Risk-Off Indicator in black
A green horizontal line marks the risk-on zone, and a red horizontal line marks the risk-off zone.
The Takeaway: My Risk-On Risk-Off Indicator is ripping to new highs, the strongest level since early November 2024.
Risk appetite is expanding.
The bulls are pressing.
This move is coming from an already bullish position. The indicator has been in risk-on mode and is now pushing higher again. The bulls are not stepping back. Money is staying on the offensive side of the trade.
The strength is coming from the right places too.
Global Stocks are outperforming Bonds. Aussie Dollar is gaining against Yen. Money is rotating toward risk and away from protection at the macro level.
Inside equities, Equal-Weight Discretionary continues to lead Equal-Weight Staples. High Beta keeps outperforming Low Volatility. Semiconductors leading Technology keeps the leadership aggressive.
This tells me that participation is healthy and that investors are choosing exposure, not protection.
When the risk-on risk-off indicator makes higher highs after already spending months in the bullish zone, it tells you the environment is not deteriorating. It is intensifying. That backdrop tends to support trend continuation and makes sustained defensive rotations harder to achieve.
Risk appetite remains strong. So, how long do the bulls keep pressing?
If you find my content valuable, I would greatly appreciate it if you could share it with your friends, family, and colleagues. Your help in spreading the word is invaluable in supporting our work. Thank you to all of you who share!