Three key leadership ratios are trading below their most important levels right now.
Here’s the chart:
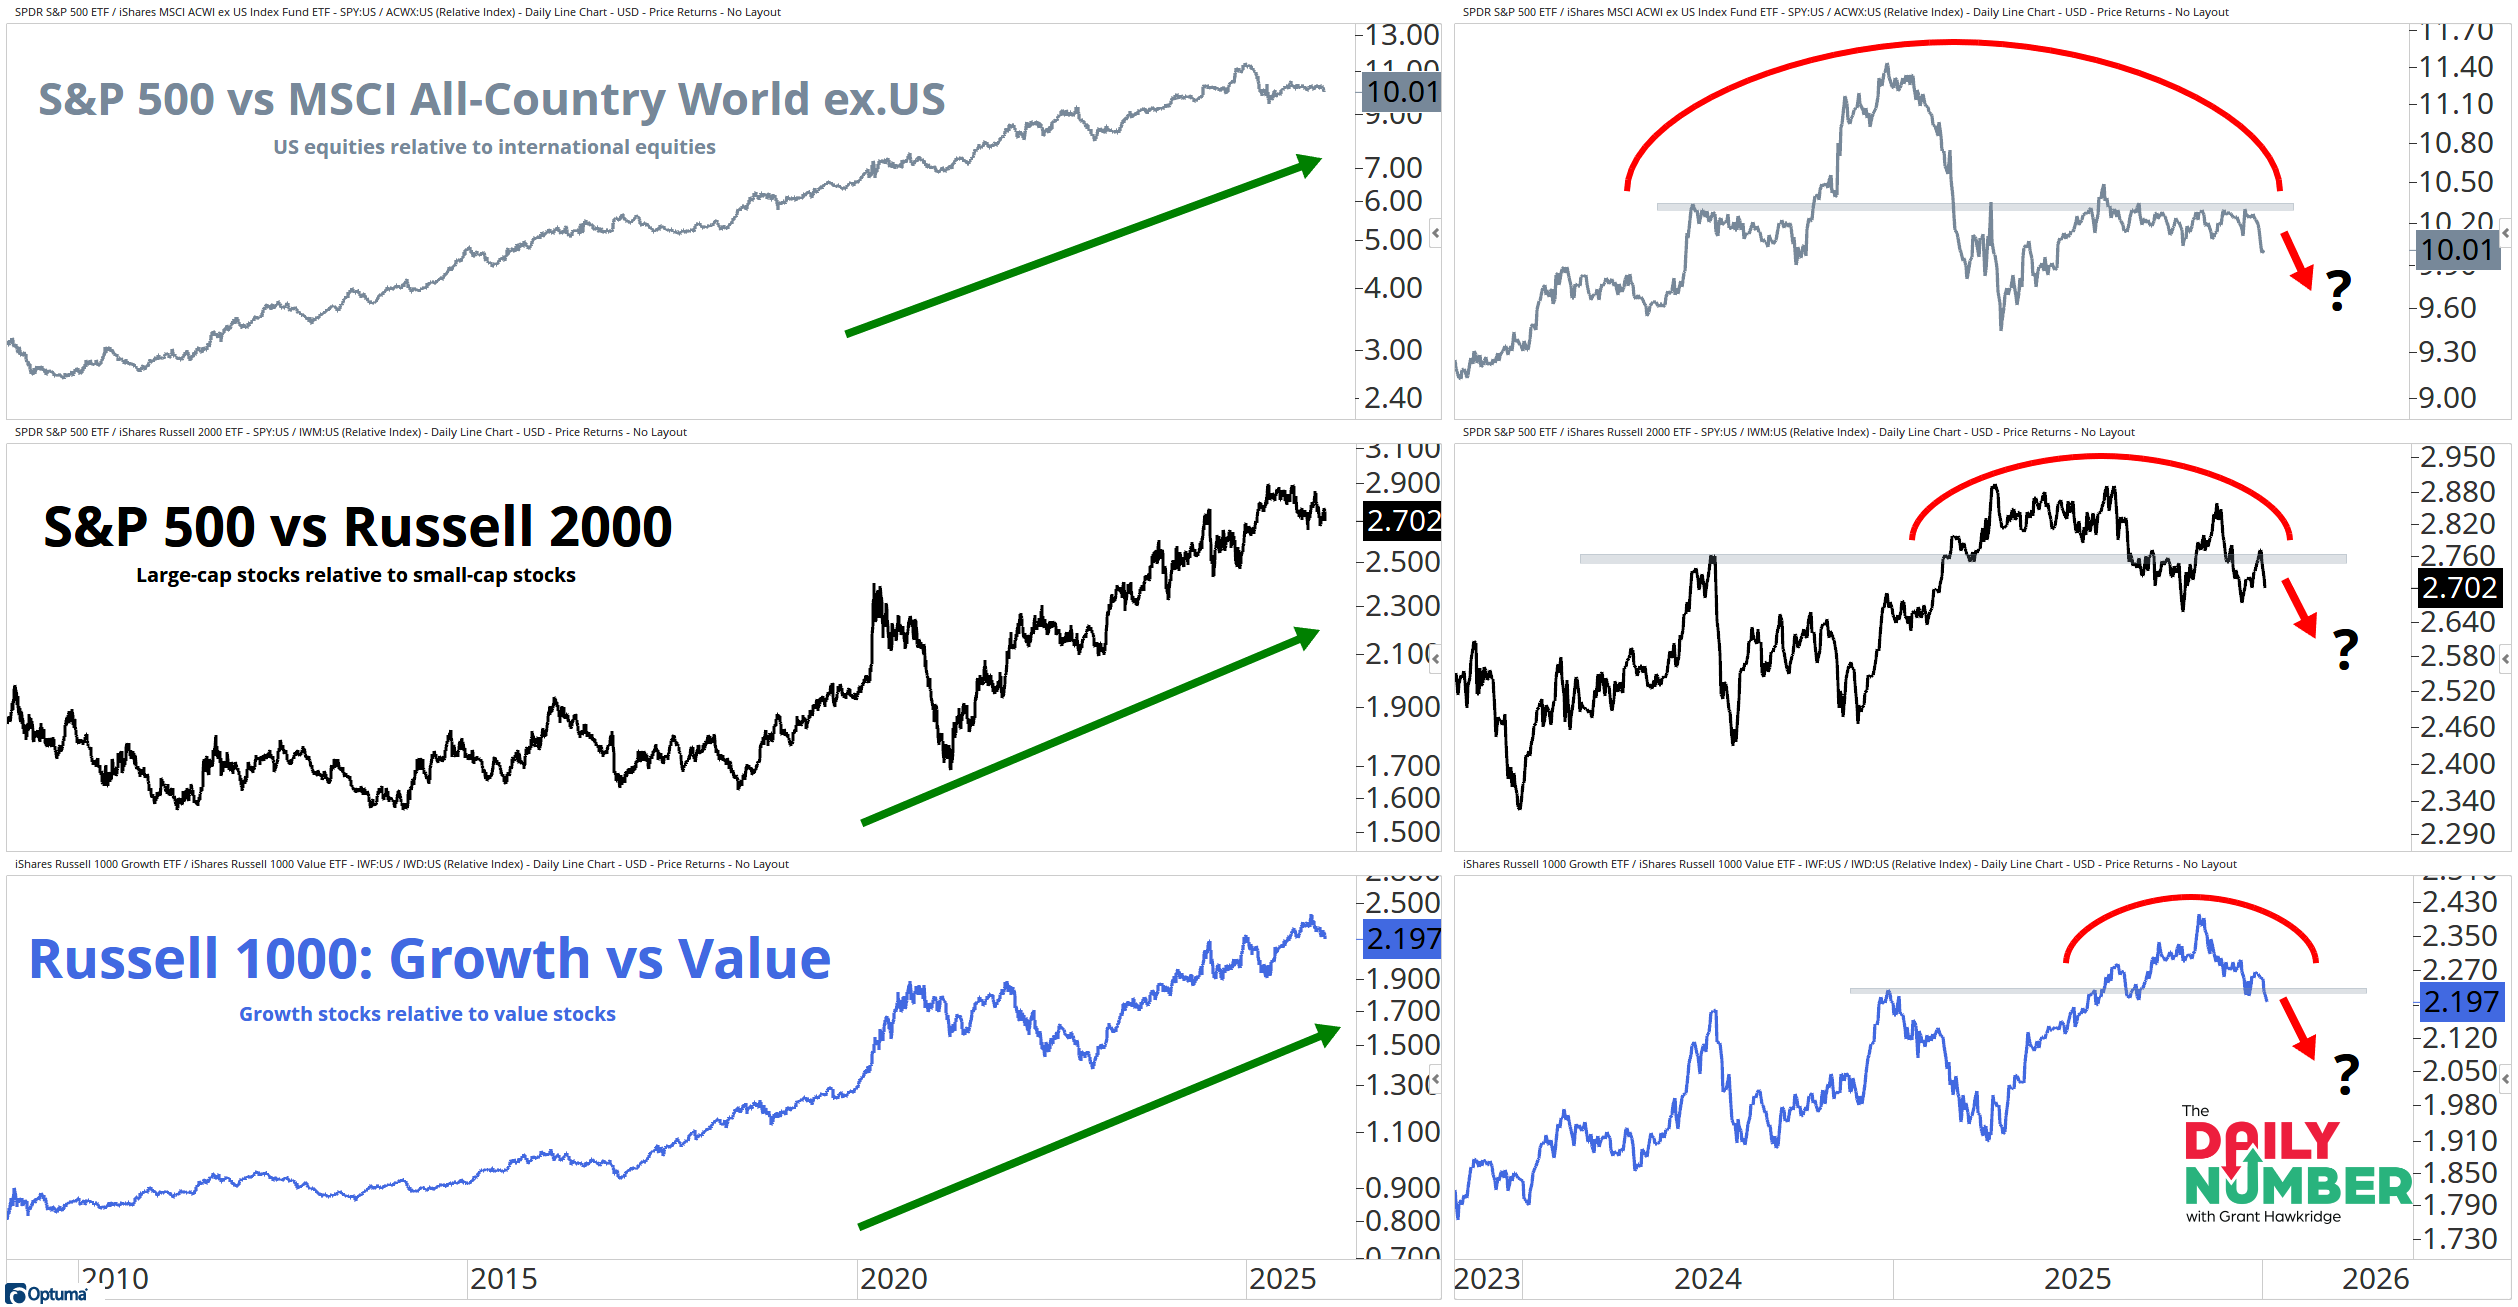
Let's break down what the chart shows:
The chart displays three relative ratios, each shown in two views. The left side shows the longer-time frame, and the right side shows a zoomed-in view.
The top ratio compares the S&P 500 to MSCI All-Country World ex-US in gray.
The second ratio compares the S&P 500 to the Russell 2000 in black.
The third ratio compares Russell 1000 Growth to Russell 1000 Value in blue.
The Takeaway: Three leadership themes that have defined the past decade are now under threat.
For years, the market default was simple.
The US beat the rest of the world.
Large caps beat small caps.
Growth beat value.
Those relationships shaped portfolios for the past decade. They became the base case.
Right now, all three are trading below their key levels. The primary trends remain on the longer-term chart. But the market is no longer paying you for assuming those relationships continue without question.
This is not about calling a new regime. It is about recognizing when the market stops rewarding the old playbook. When past leadership slips under key levels, the burden of proof flips.
After long runs, leaders lose urgency and stop extending. Rallies get shorter, pullbacks take longer. Money does not leave the market, it starts looking for areas that are working better.
From here, either these past leadership themes reclaim their levels, and the last decade stays intact. Or they remain capped and the market starts rewarding the other side of the trade.
So, do these leaders regain control, or does the market move on?
If you find my content valuable, I would greatly appreciate it if you could share it with your friends, family, and colleagues. Your help in spreading the word is invaluable in supporting our work. Thank you to all of you who share!