Roughly 70% of stocks across large, mid, and small caps are now above their 50-day moving averages.
Here’s the chart:
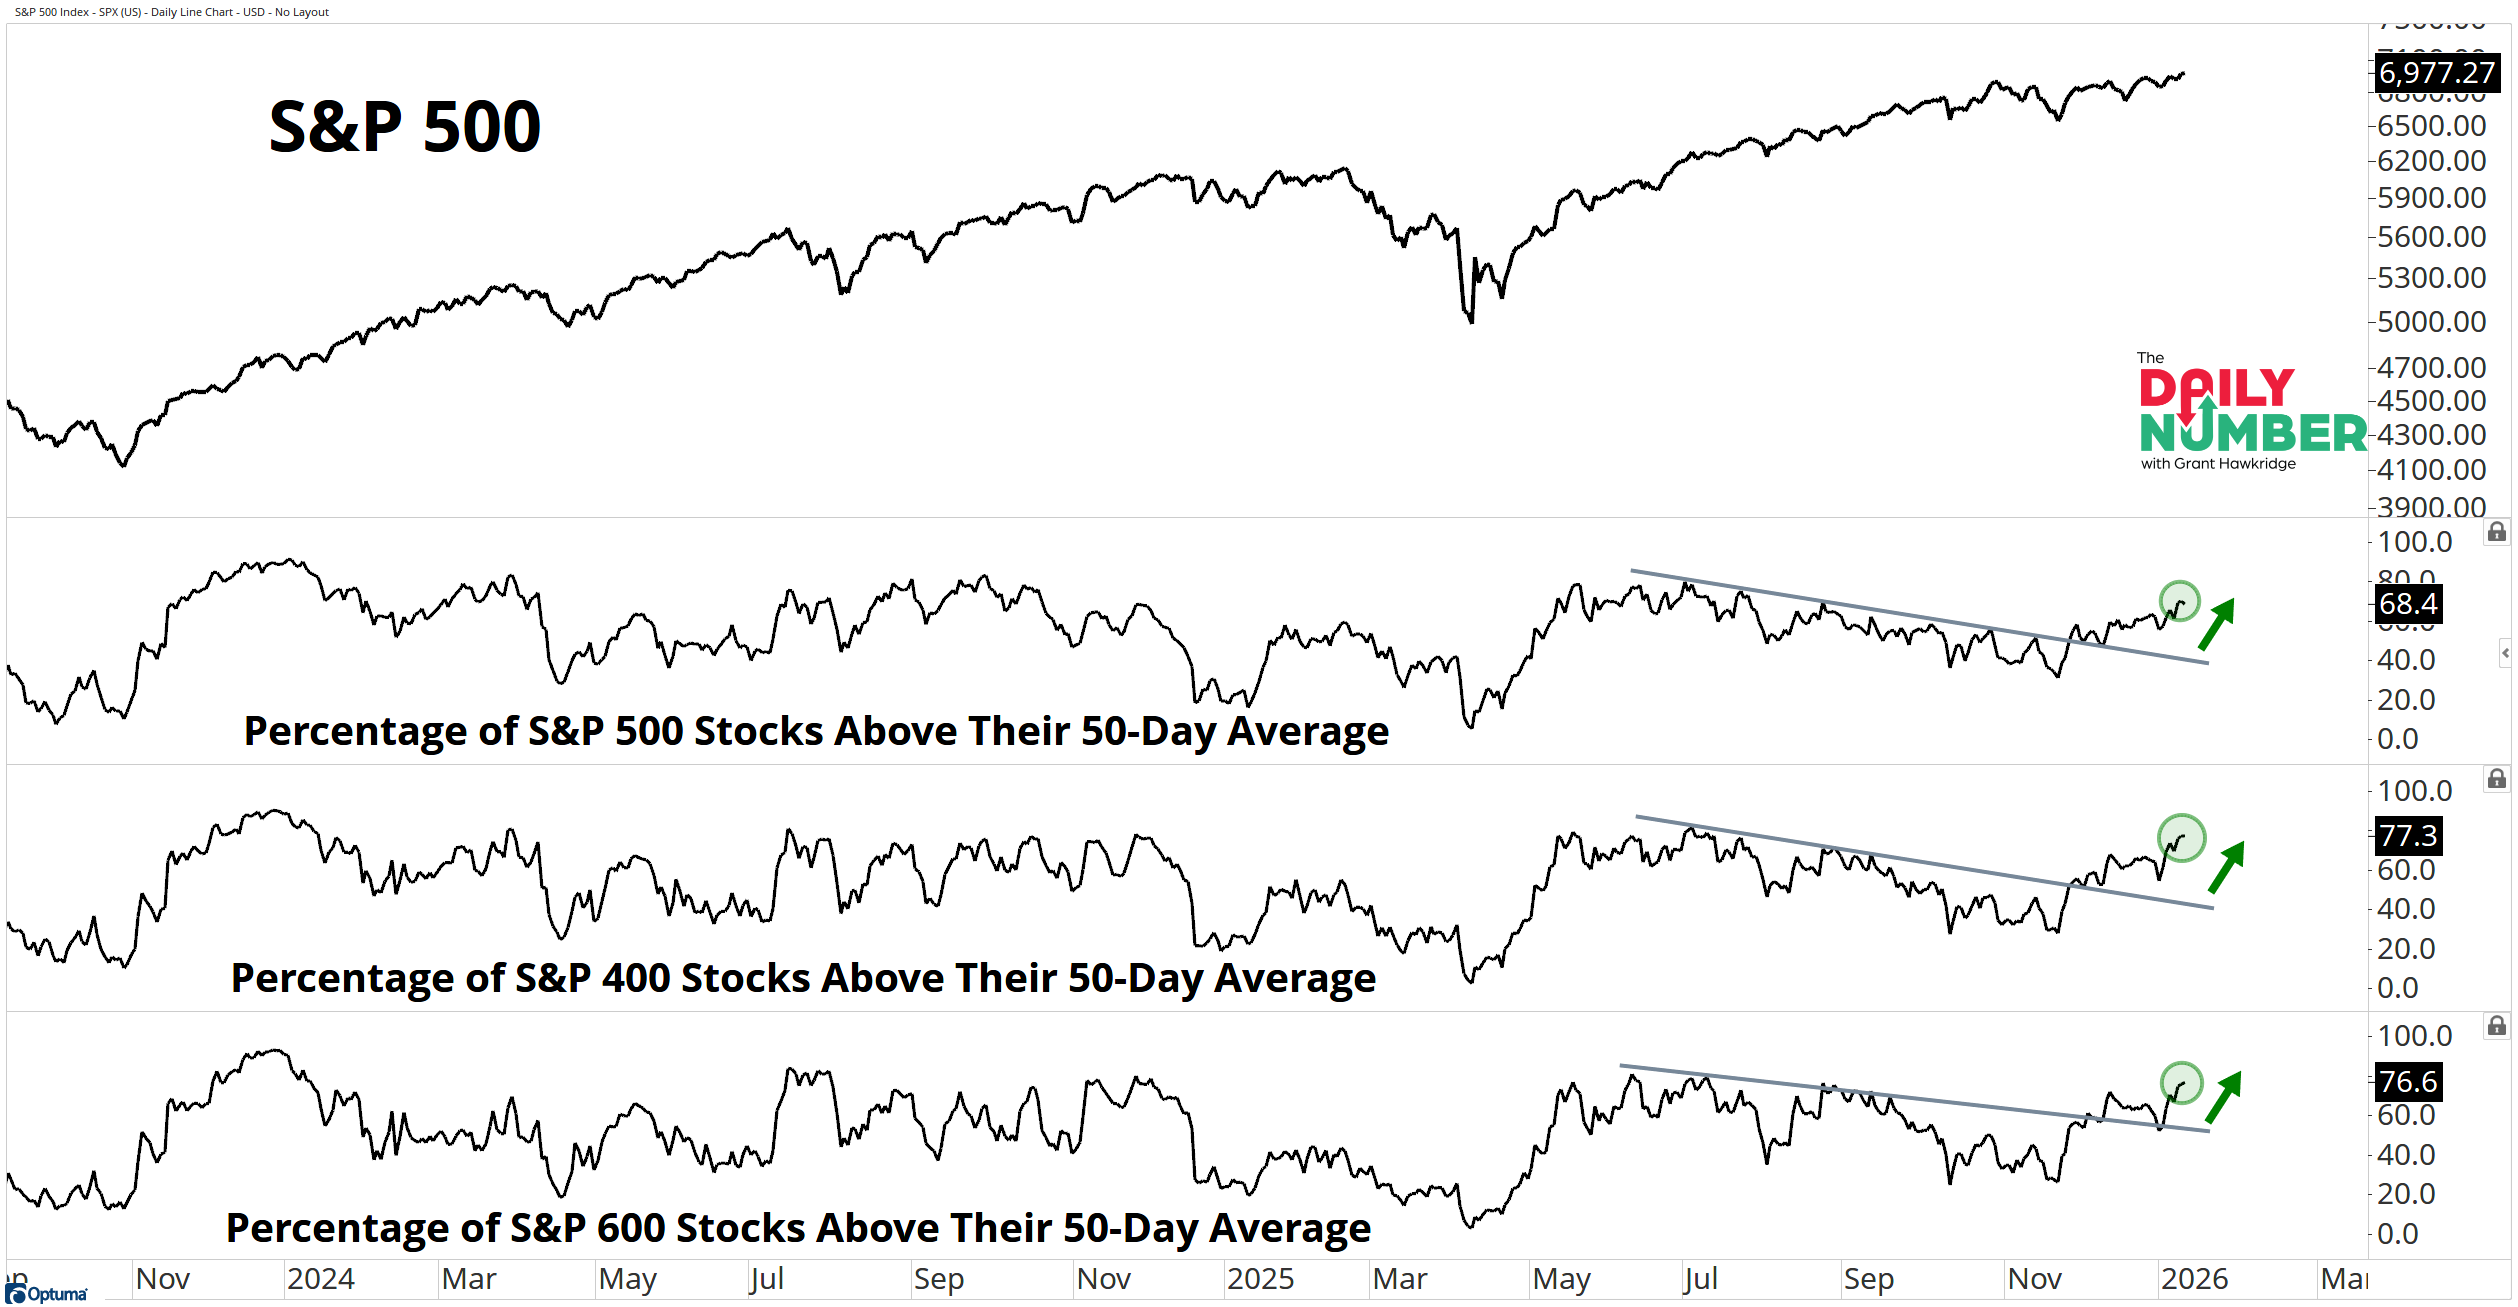
Let's break down what the chart shows:
The top panel shows the S&P 500 daily price.
The second panel tracks the percentage of S&P 500 (large-caps) stocks above their 50-day moving average.
The third panel tracks the percentage of S&P 400 (mid-caps) stocks above their 50-day moving average.
The fourth panel tracks the percentage of S&P 600 (small-caps) stocks above their 50-day moving average.
The Takeaway: Around 70% of stocks across every size factor are now in intermediate uptrends.
That defines the current environment. This is not about index levels or who is leading. This is about trend strength across the overall market.
Breadth stalled for months. Participation pulled back. That phase is now done.
Most stocks are now back above their 50-day moving averages at the same time. Large-caps did not move alone. Mid-caps and small-caps joined the party. This is how trend strength widens and risk appetite spreads across the market.
When two-thirds of stocks are in intermediate uptrends, weakness trades differently. Selloffs lose their bite. Pullbacks rotate instead of breaking trends.
This current expansion in breadth signals that demand is no longer selective. The bulls are active across the full list, not just in a few names.
From here, it comes down to follow-through. Broad participation keeps the trend intact. Narrowing participation shifts the tone.
But right now, the environment is defined by broad trend strength… Why fight it?
So, are you positioned for expansion, or still trading as if participation is thin?
If you find my content valuable, I would greatly appreciate it if you could share it with your friends, family, and colleagues. Your help in spreading the word is invaluable in supporting our work. Thank you to all of you who share!