Equal-weight Industrials just pushed to a new relative high versus the equal-weight S&P 500.
Here’s the chart:
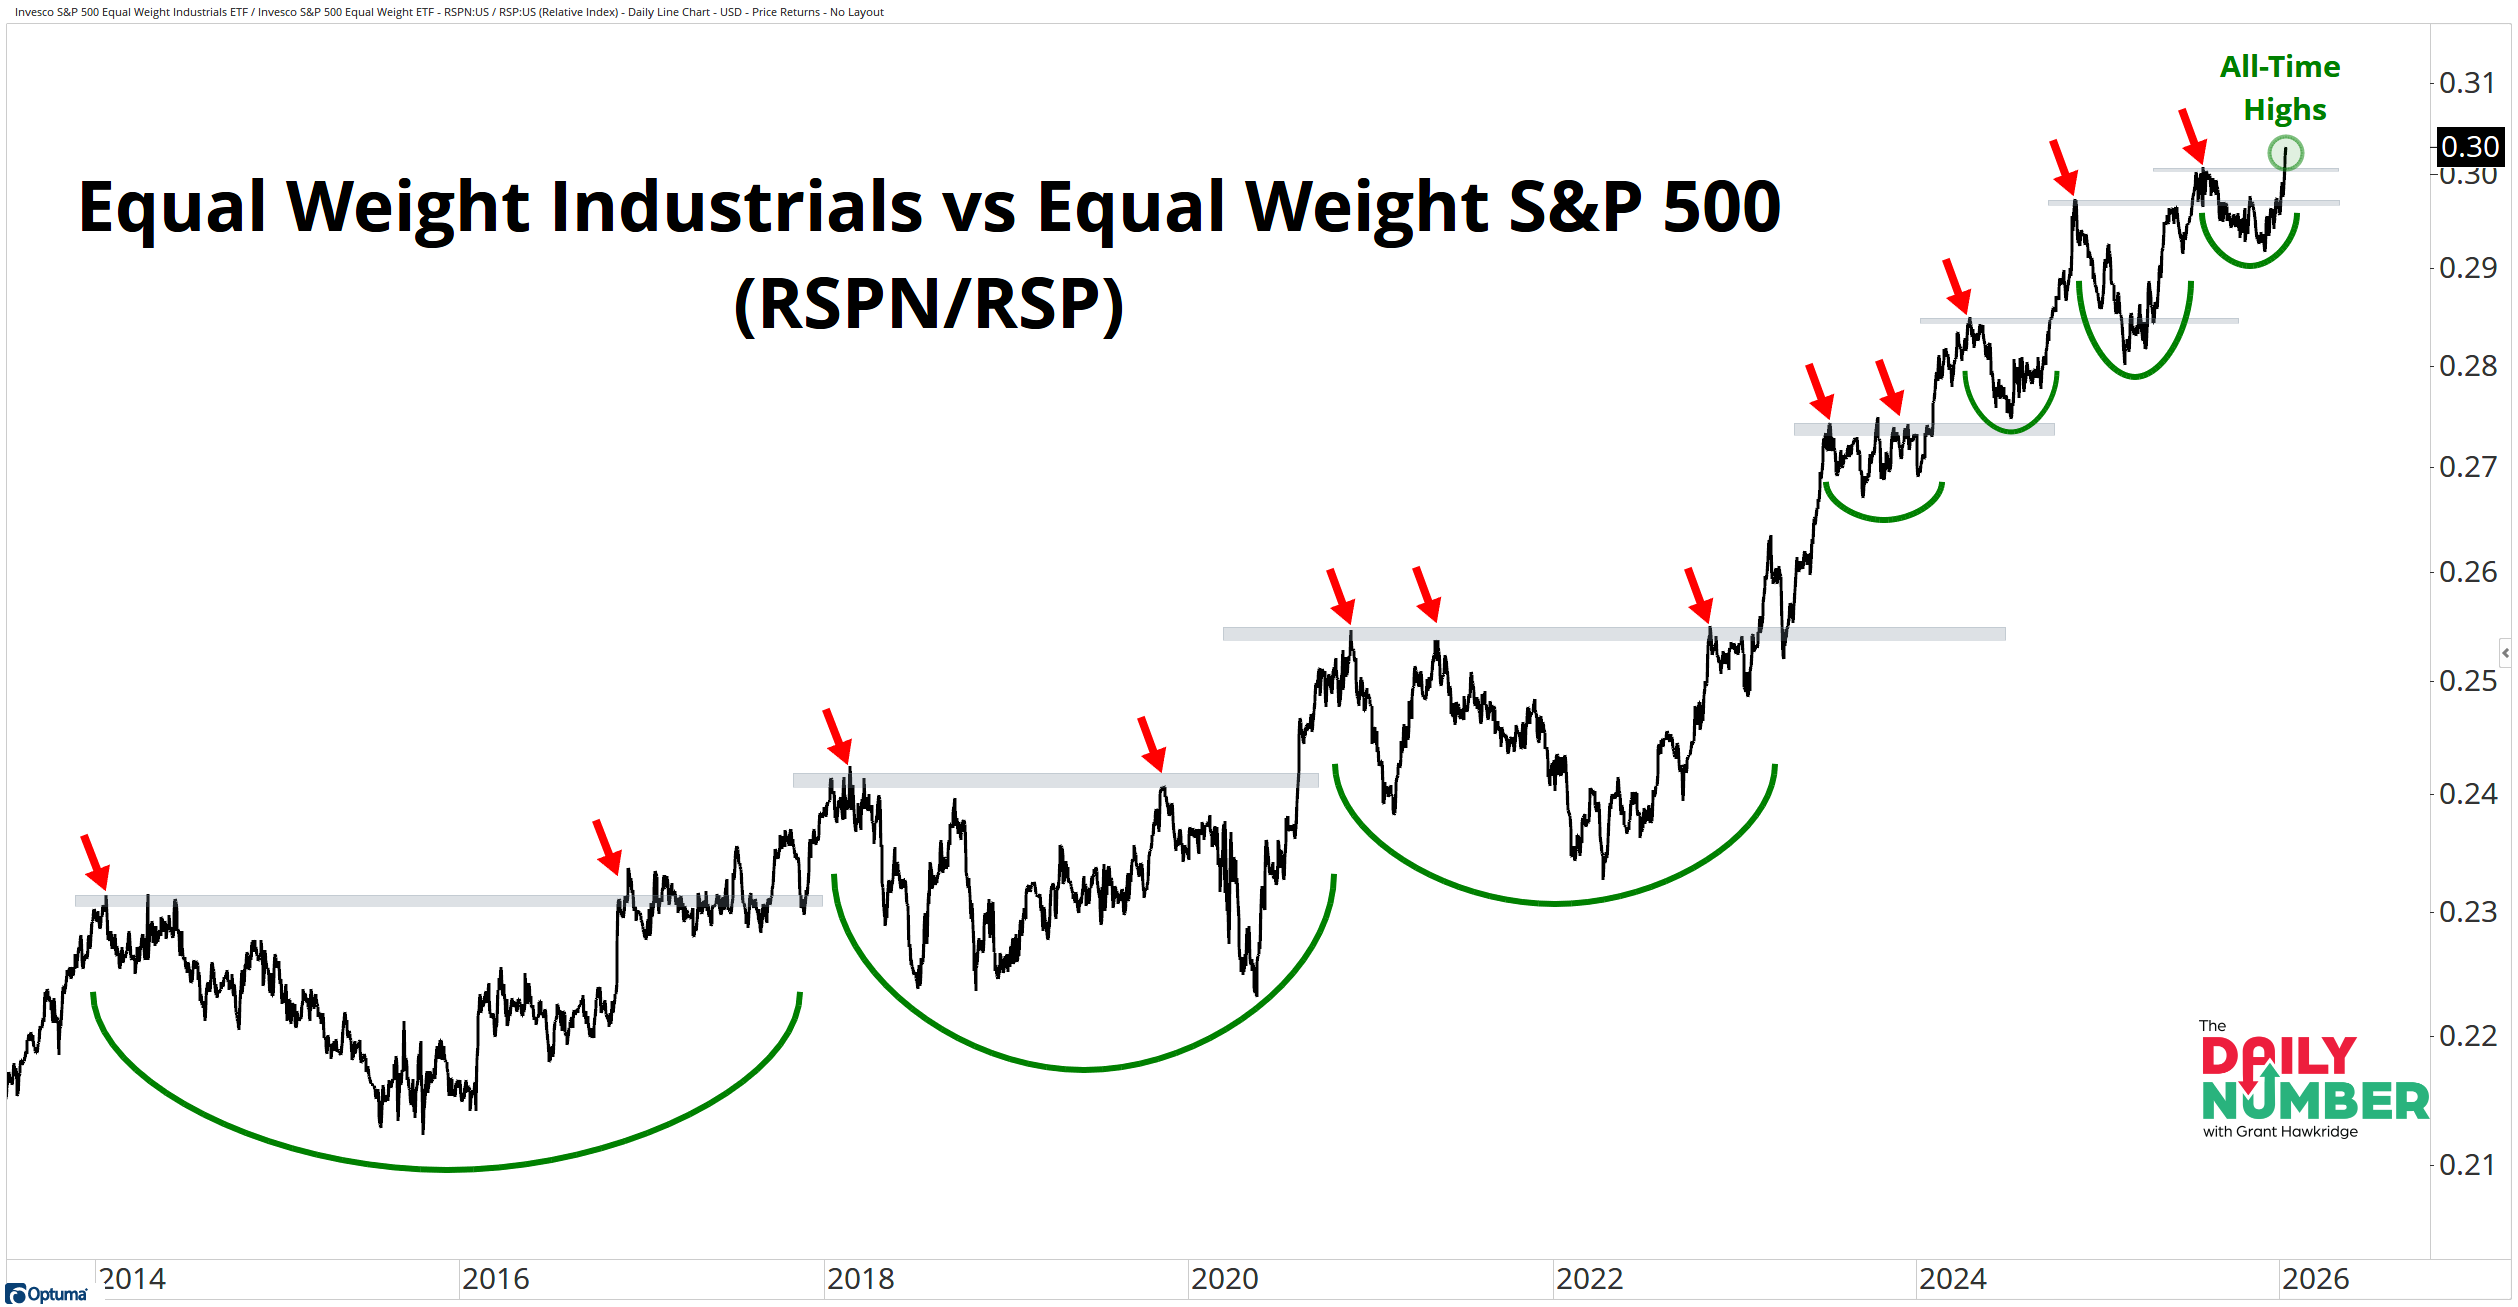
Let's break down what the chart shows:
The chart shows a black line that represents the relative performance of equal-weight Industrials versus the equal-weight S&P 500.
The Takeaway: Equal-weight Industrials just pushed to a new relative high versus the equal-weight S&P 500. That keeps a decade-long relative uptrend intact.
Leadership like this does not survive that long by accident.
This has been an orderly stair-stepping uptrend, not a straight-up advance. Each push higher pauses. Each pause resolves higher. Higher highs and higher lows stay intact. That rhythm defines leadership that is being accepted.
Pullbacks in this ratio have been sideways. Time does the work instead of price. That's normal behavior that we see in strong relative trends.
Every breakout over this period has held at support. Prior relative highs have become the floor. That price behavior keeps the pressure on anyone betting against this trend.
Leadership like this only shows up in risk-on regimes. Industrials do not lead when markets are defensive or stressed. This ratio holds up when money stays committed to growth and participation.
Leadership here is broad. Equal-weight strength means many stocks are advancing together. Gains are shared across the group, not carried by a few names. That keeps pullbacks shallow and the trend intact.
And right now, there is no overhead supply left to absorb. It's a bull market!
This trend keeps rewarding exposure. Are you still waiting for failure?
If you find my content valuable, I would greatly appreciate it if you could share it with your friends, family, and colleagues. Your help in spreading the word is invaluable in supporting our work. Thank you to all of you who share!