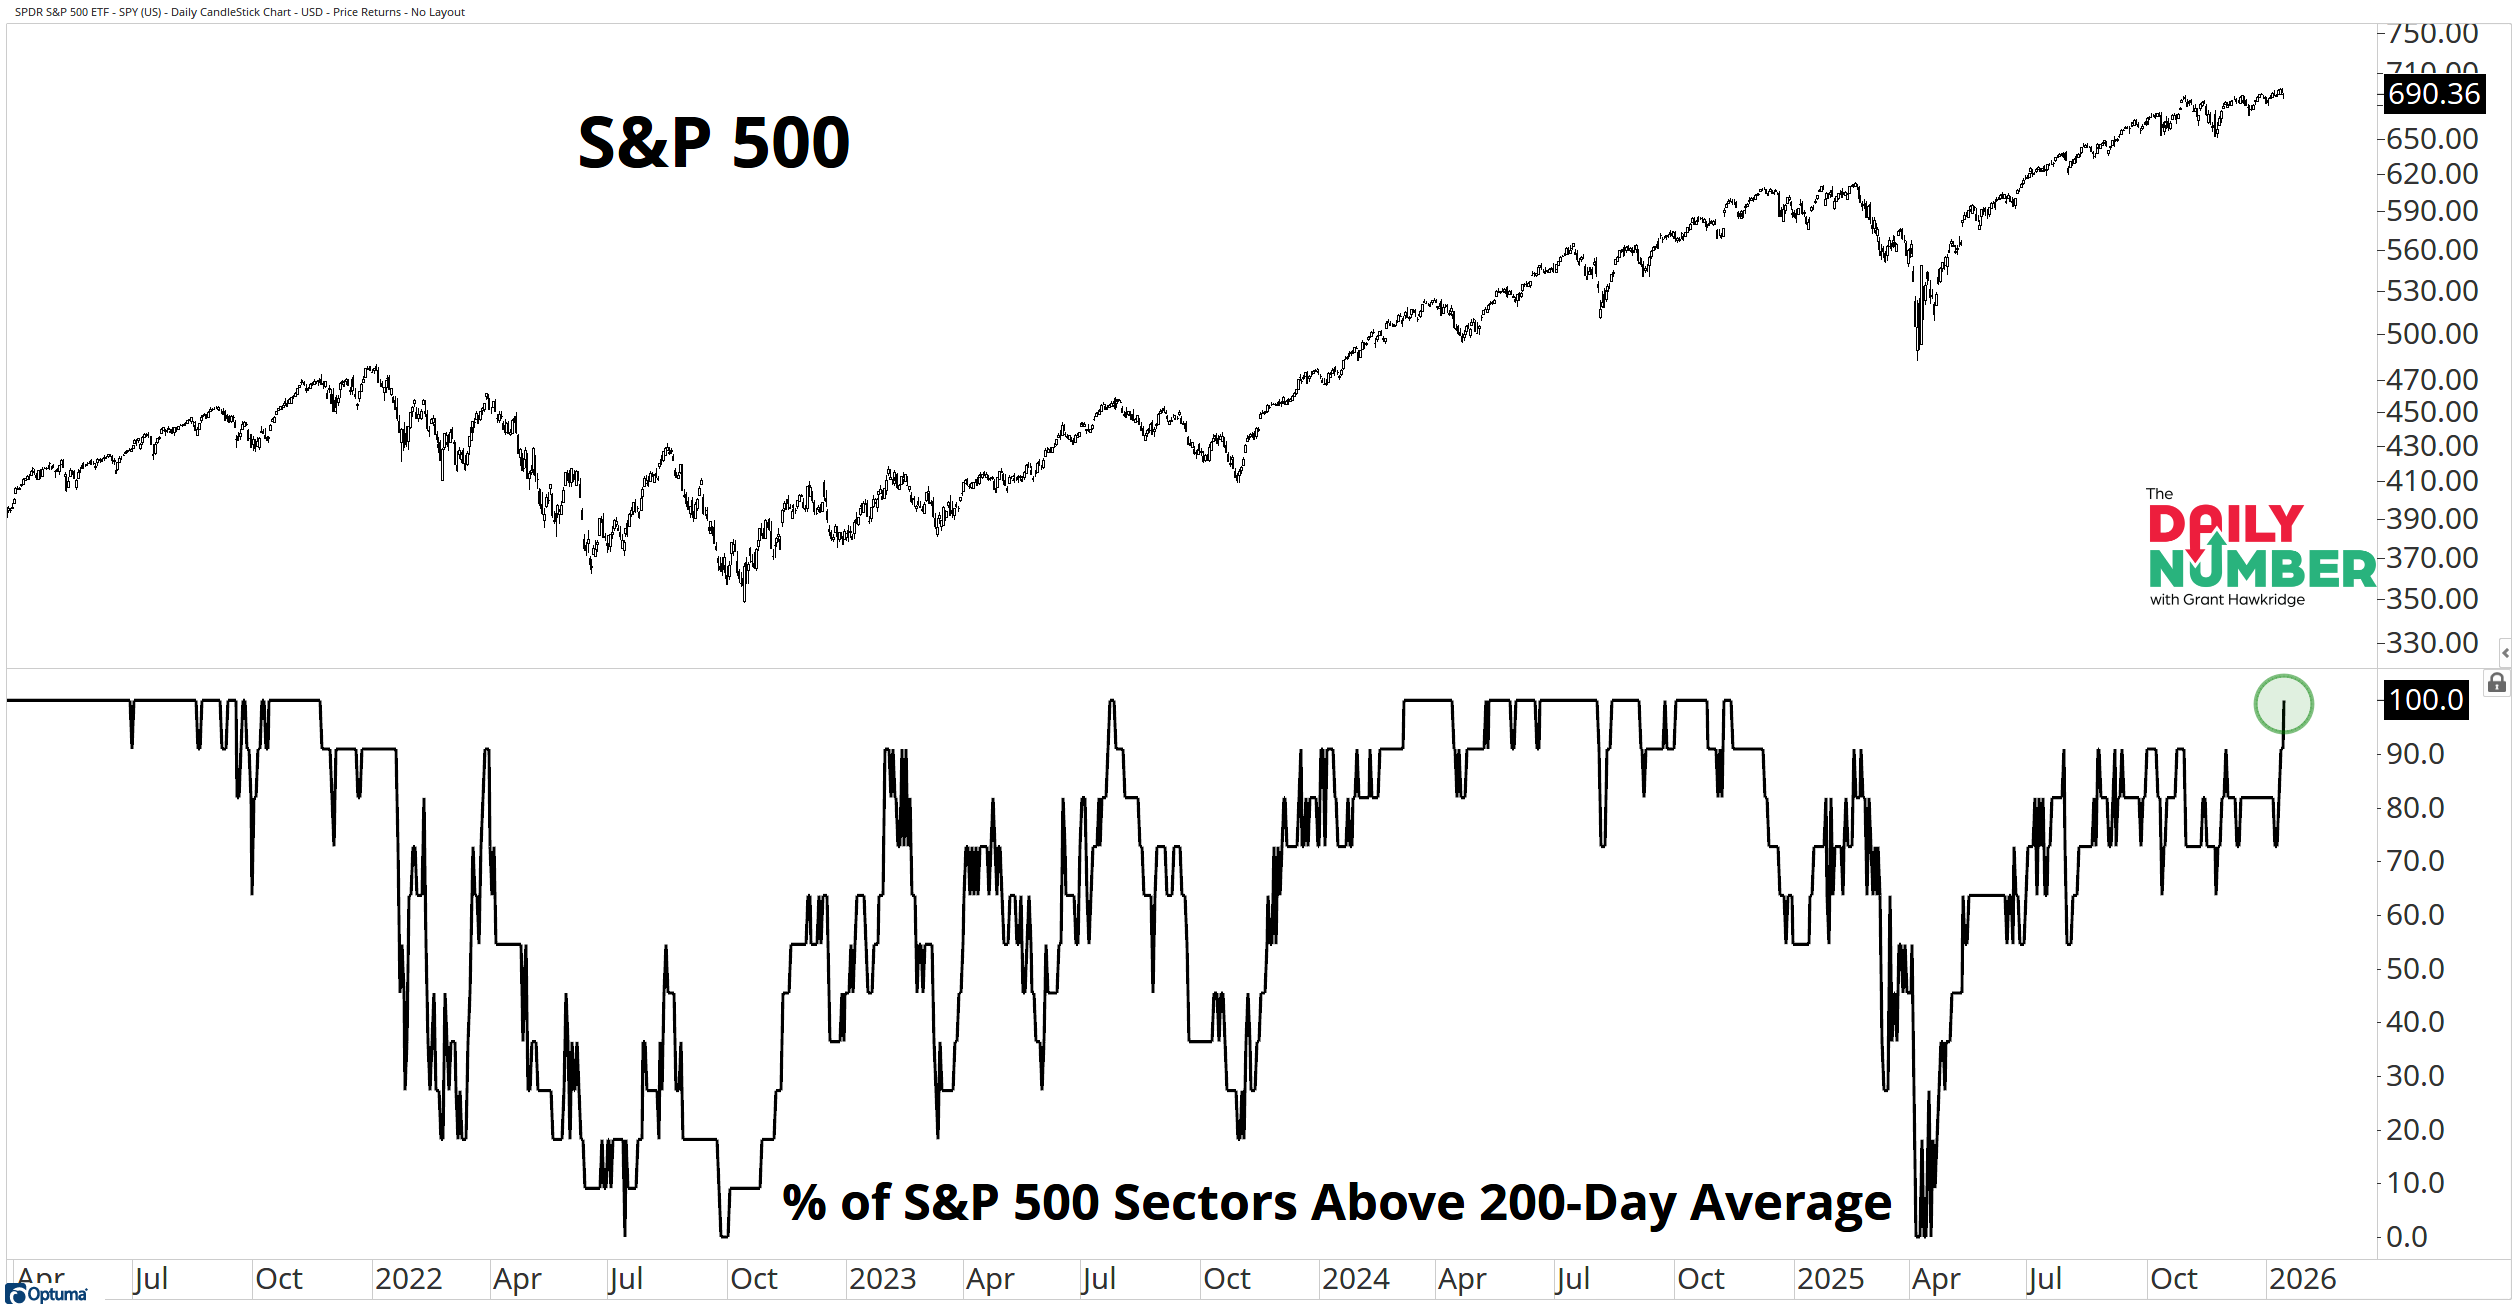
The percentage of S&P 500 sectors trading above their 200-day moving average just pushed back to 100%, the highest level since November 2024.
Here’s the chart:
Let's break down what the chart shows:
The chart displays the S&P 500 daily price in the top panel
The lower panel displays the percentage of S&P 500 sectors above their 200-day moving average.
The Takeaway: Every major S&P 500 sector is currently trading above its 200-day moving average… That’s full participation!
Moves in this breadth reading to 100% only happen in bull markets. They do not appear during weak markets. When participation reaches this zone, long-term trends are aligned across all sectors, not just propped up by one or two leaders.
This strength is not coming from one pocket. Most sectors are already pressing right up against their highs, and several are well extended above this long-term trend at the same time. There is only one real laggard: Real Estate. Everything else is participating. Weakness is not spreading. It is getting ignored.
When participation looks like this, breakdowns struggle to follow through. Pullbacks stay shallow. That is how strong bull markets behave while they keep moving higher.
Risk does not come from being long when participation is this strong. Risk comes from waiting for confirmation that already happened and then chasing later.
As long as participation stays this broad, the market keeps rewarding exposure. Pullbacks stay contained, and weakness fails to spread.
Are you trading what is happening, or what you think should happen?
If you find my content valuable, I would greatly appreciate it if you could share it with your friends, family, and colleagues. Your help in spreading the word is invaluable in supporting our work. Thank you to all of you who share!