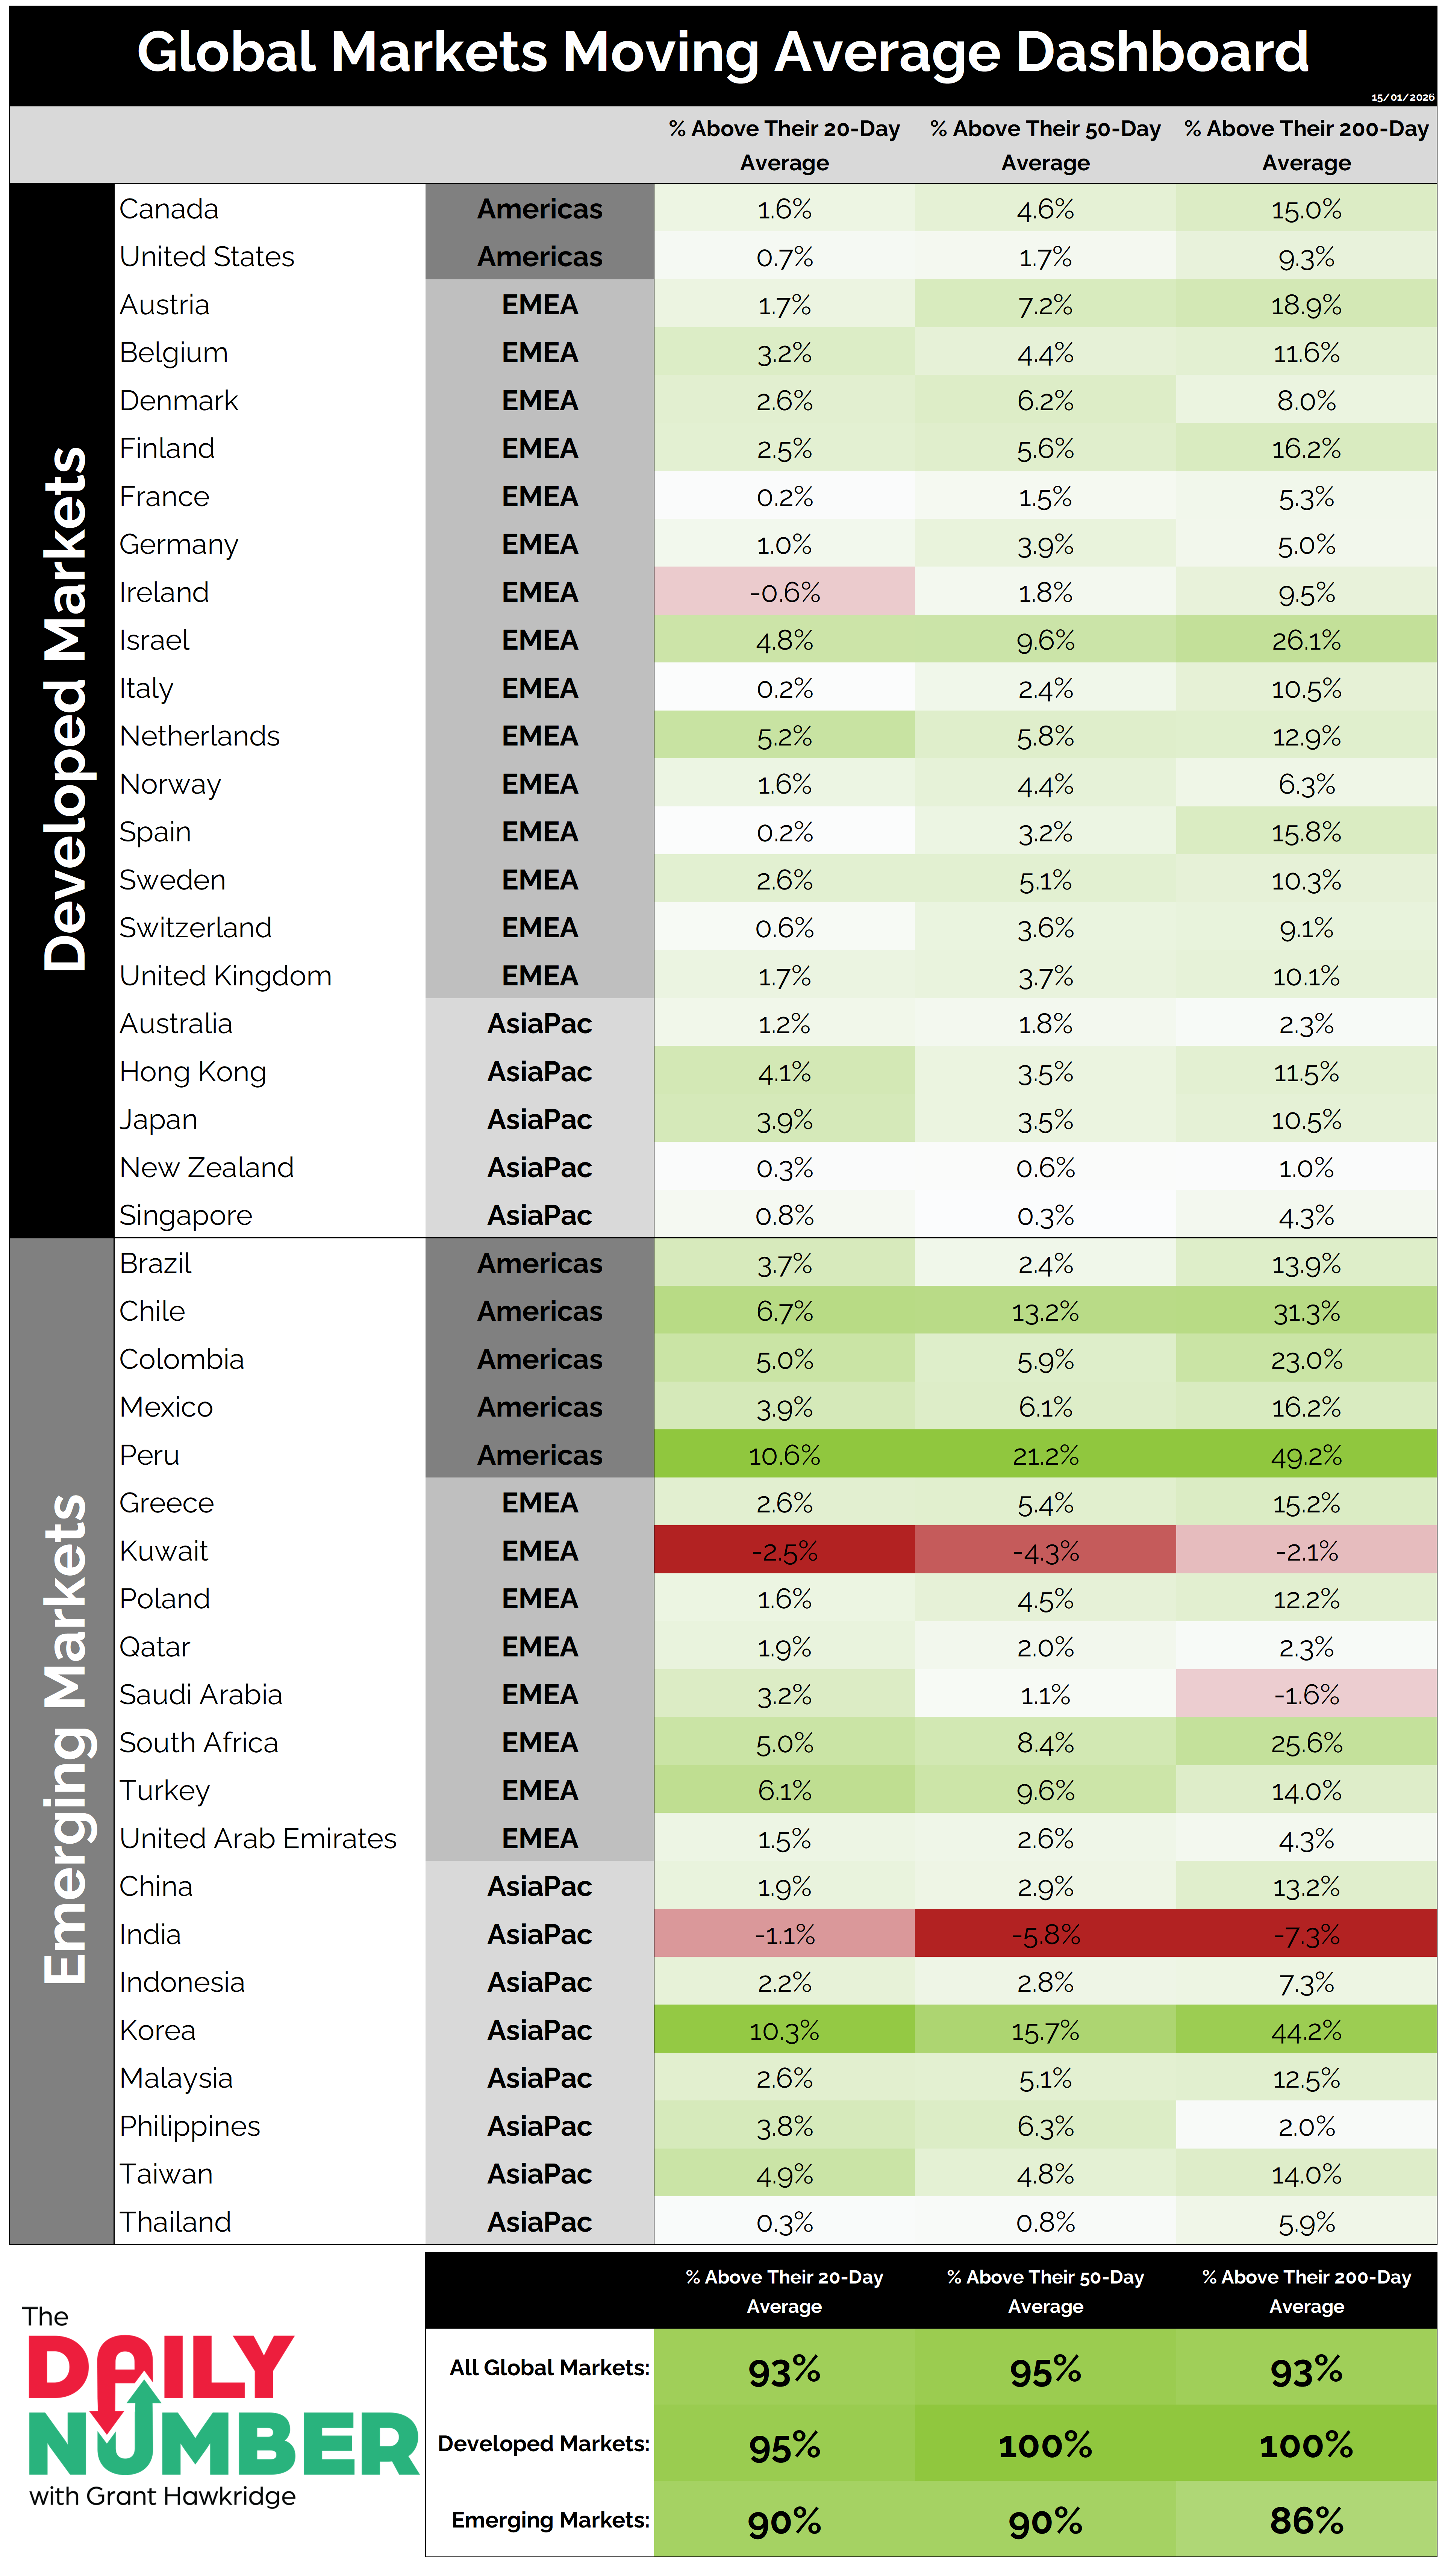
100% of developed markets are trading above both their 50-day and 200-day moving averages.
Here’s the table:
Let's break down what the table shows:
The table displays global markets grouped into developed and emerging regions.
Each market row includes three columns showing the % of markets above their 20-day, 50-day, and 200-day moving averages.
A summary section at the bottom reports aggregate readings for all global, developed, and emerging markets across the three timeframes.
The Takeaway: Global markets are in strong uptrends, with most holding above key trend levels on short-, intermediate-, and long-term timeframes.
Developed markets are leading the way higher, with every developed market we track is above its 50-day and 200-day moving average. That is trend strength across both momentum and direction. There is no disagreement between timeframes.
The 50-day keeps you on the right side of momentum.
The 200-day keeps you on the right side of the primary trend.
When both are at 100%, dips do not stick.
And most of the emerging markets also remain above their long-term trends.
Leadership around the globe is not narrow. This move is not coming from one region. Strength is spread around the world. This setup favors staying long equity markets. Trends like this do not fail suddenly. They first weaken. Then they break. Neither is happening here.
If global markets were in trouble, these averages would be failing. They are not.
So, when global markets are above trend across the board, why bet against them?
If you find my content valuable, I would greatly appreciate it if you could share it with your friends, family, and colleagues. Your help in spreading the word is invaluable in supporting our work. Thank you to all of you who share!