Global markets have posted more 52-week highs than 52-week lows on 166 of the past 187 trading days since April 22, 2025.
Here’s the chart:
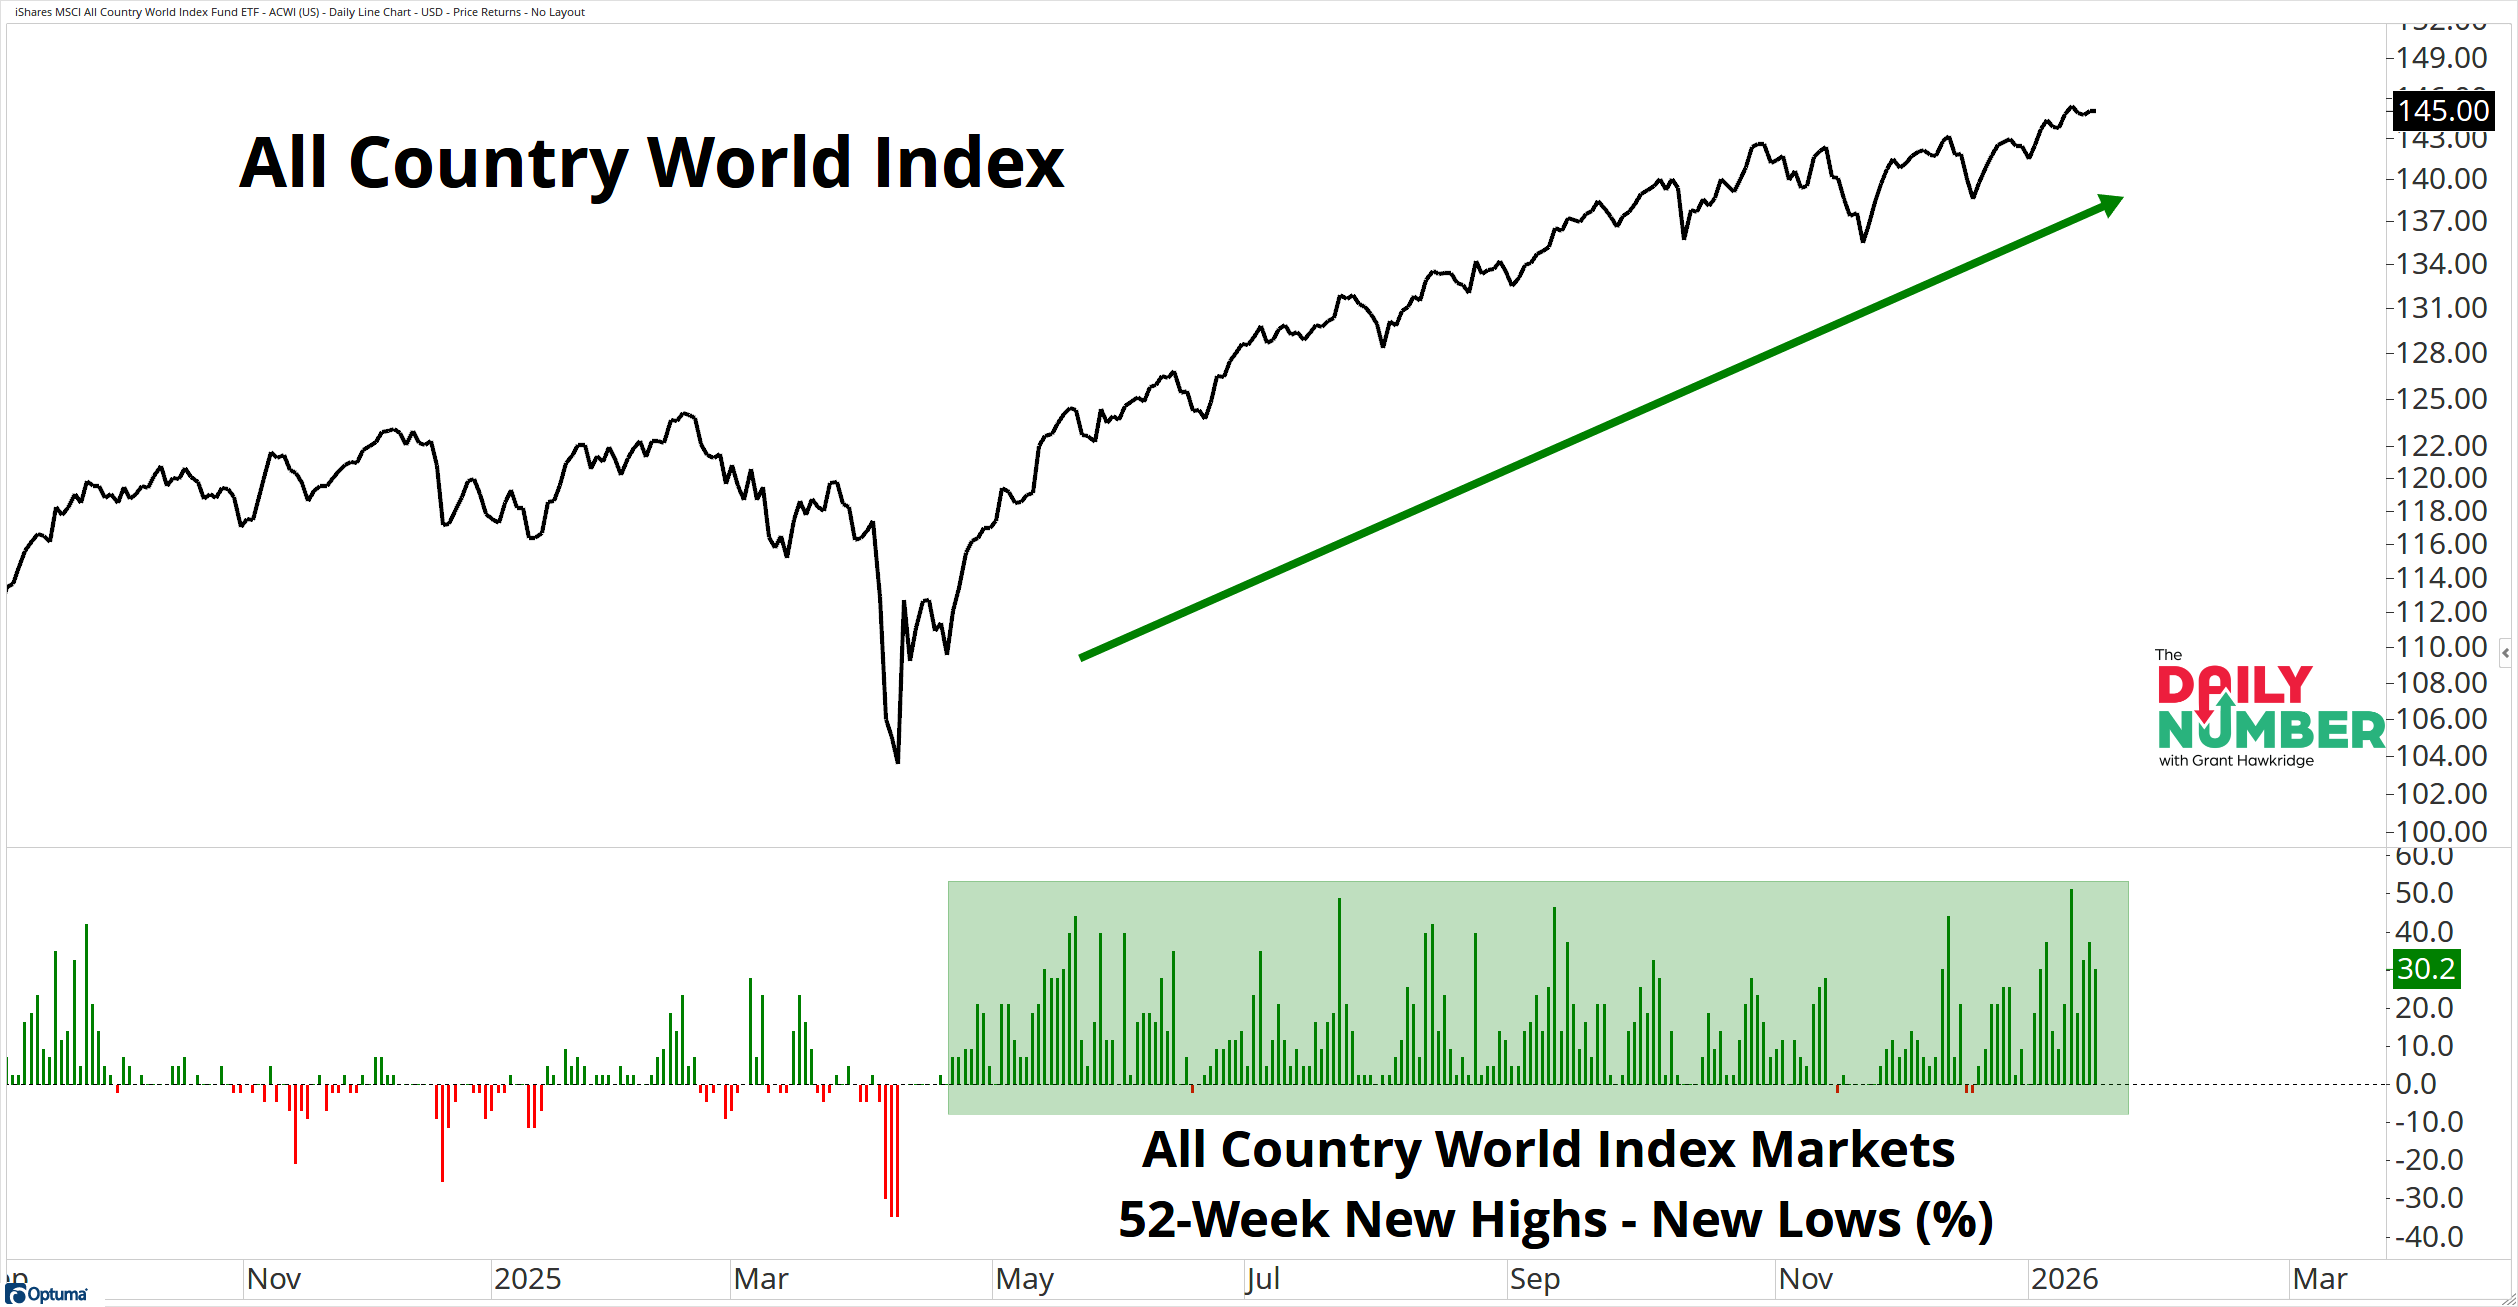
Let's break down what the chart shows:
The top panel displays the All Country World Index price as a black line.
The lower panel displays vertical bars representing the daily percentage difference between 52-week new highs and new lows across global markets.
Green bars appear above a horizontal zero line when 52-week new highs exceed new lows.
Red bars appear below the zero line when 52-week new lows exceed new highs.
The Takeaway: Out of the last 187 trading days, global markets posted more new highs than new lows on 166 days.
That is 88.8% of the time.
This is global market strength that has stayed one-way for months, not days.
When new highs win out consistently, pullbacks fail to gain much ground. Selling shows up, but it does not compound. Weak spots appear, then strength replaces them somewhere else.
That behavior explains why every dip since late April has stayed brief. Risk has not left the market. It has shifted. Breadth keeps reloading instead of breaking down, and price keeps leaning forward.
This kind of breadth does not show up in countertrend moves. It shows up when primary trends are already pointed higher. New highs winning this often means the bigger trend is doing the work, not just short-term momentum.
Runs that last this long do not end with one bad day. They leave clues first. New lows cluster. Highs stop winning. None of that is happening yet.
So the question is not whether this is strong. The question is whether you will recognize the change when new highs stop doing the work.
If you find my content valuable, I would greatly appreciate it if you could share it with your friends, family, and colleagues. Your help in spreading the word is invaluable in supporting our work. Thank you to all of you who share!