Materials vs the S&P 500 just hit a 6-month high after a long stretch of relative weakness.
Here’s the chart:
Let's break down what the chart shows:
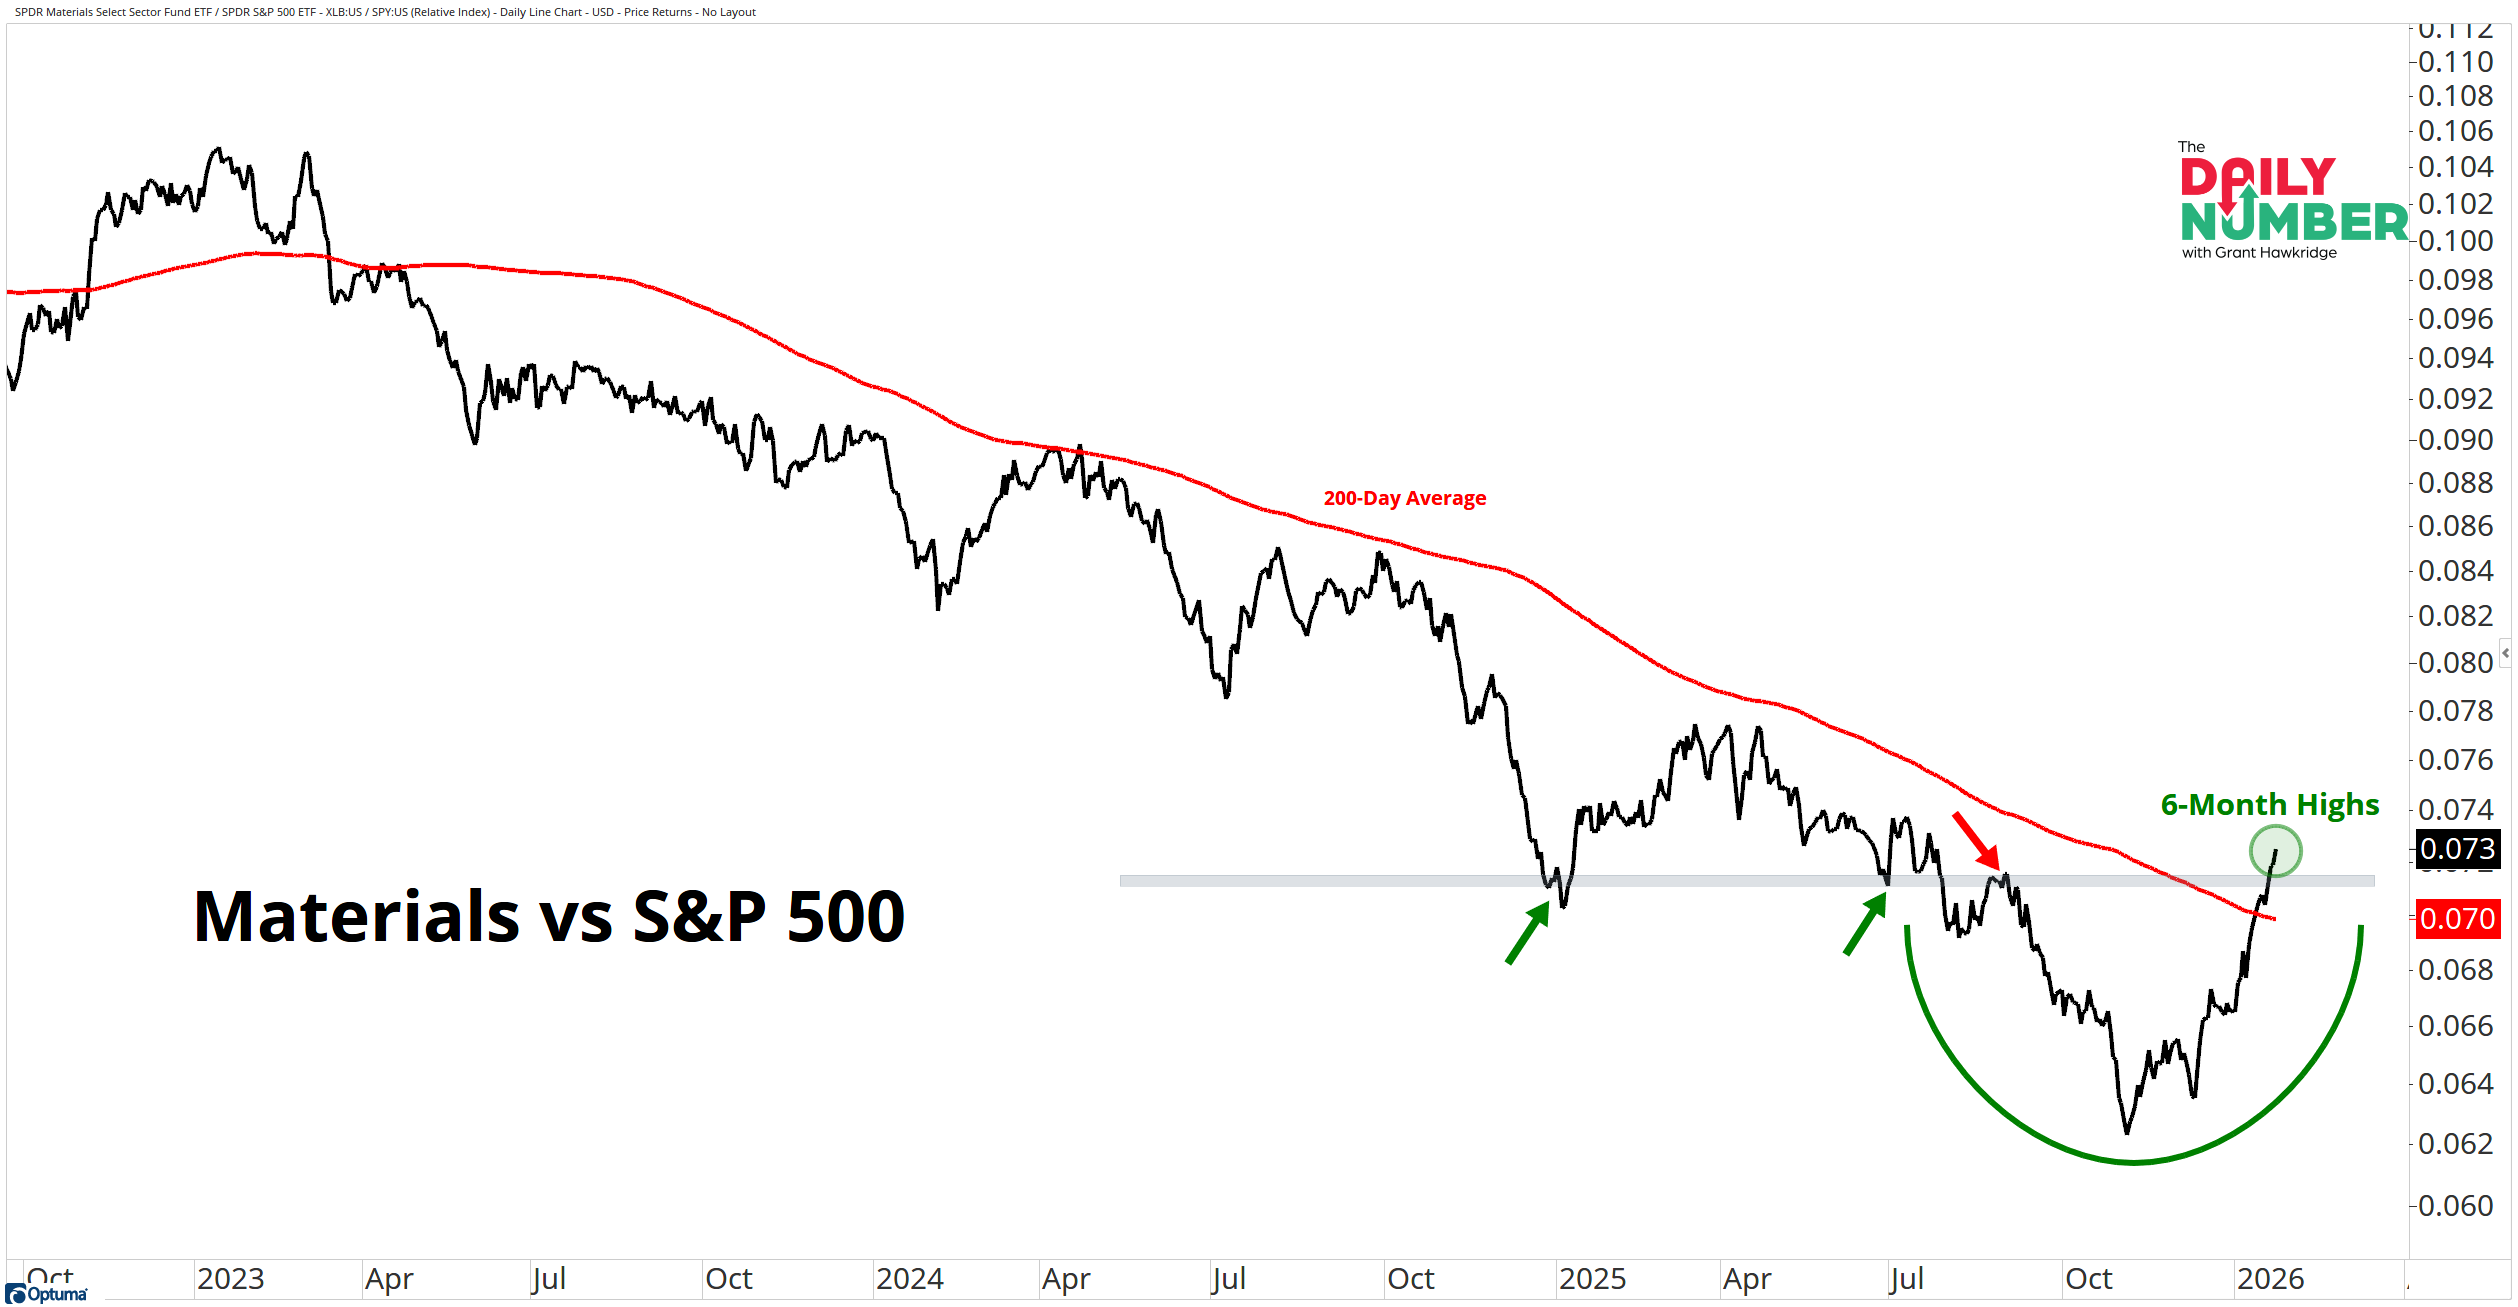
The chart displays a black line tracking the relative performance of Materials versus the S&P 500.
A red line plots the 200-day moving average of that relative ratio.
The Takeaway: Materials just printed a 6-month high relative to the S&P 500.
That move completes a bearish-to-bullish reversal pattern.
This is the first meaningful push back above the 200-day moving average since 2022. That level has capped every relative rally for nearly two years. Getting back above it puts this move in a different category than prior bounces.
But this is not just a relative story.
Materials also closed at all-time highs on an absolute basis last week.
And the year-to-date performance of materials is leading all other sectors.
Absolute price strength is already in place, and relative strength is now starting to turn.
Leadership like this does not appear all at once. It starts with a bearish-to-bullish reversal, then higher lows, then pressure building against long-term trend levels. That is the phase Materials is entering now.
This is not about chasing Materials. This is about tracking rotation beneath the index while headline leadership grabs attention elsewhere.
This has just moved onto my radar. So, is money rotating back toward value names in a meaningful way?
If you find my content valuable, I would greatly appreciate it if you could share it with your friends, family, and colleagues. Your help in spreading the word is invaluable in supporting our work. Thank you to all of you who share!