The S&P 500 has traded above its 10-month moving average 71.5% of the time since 1950.
Here’s the chart:
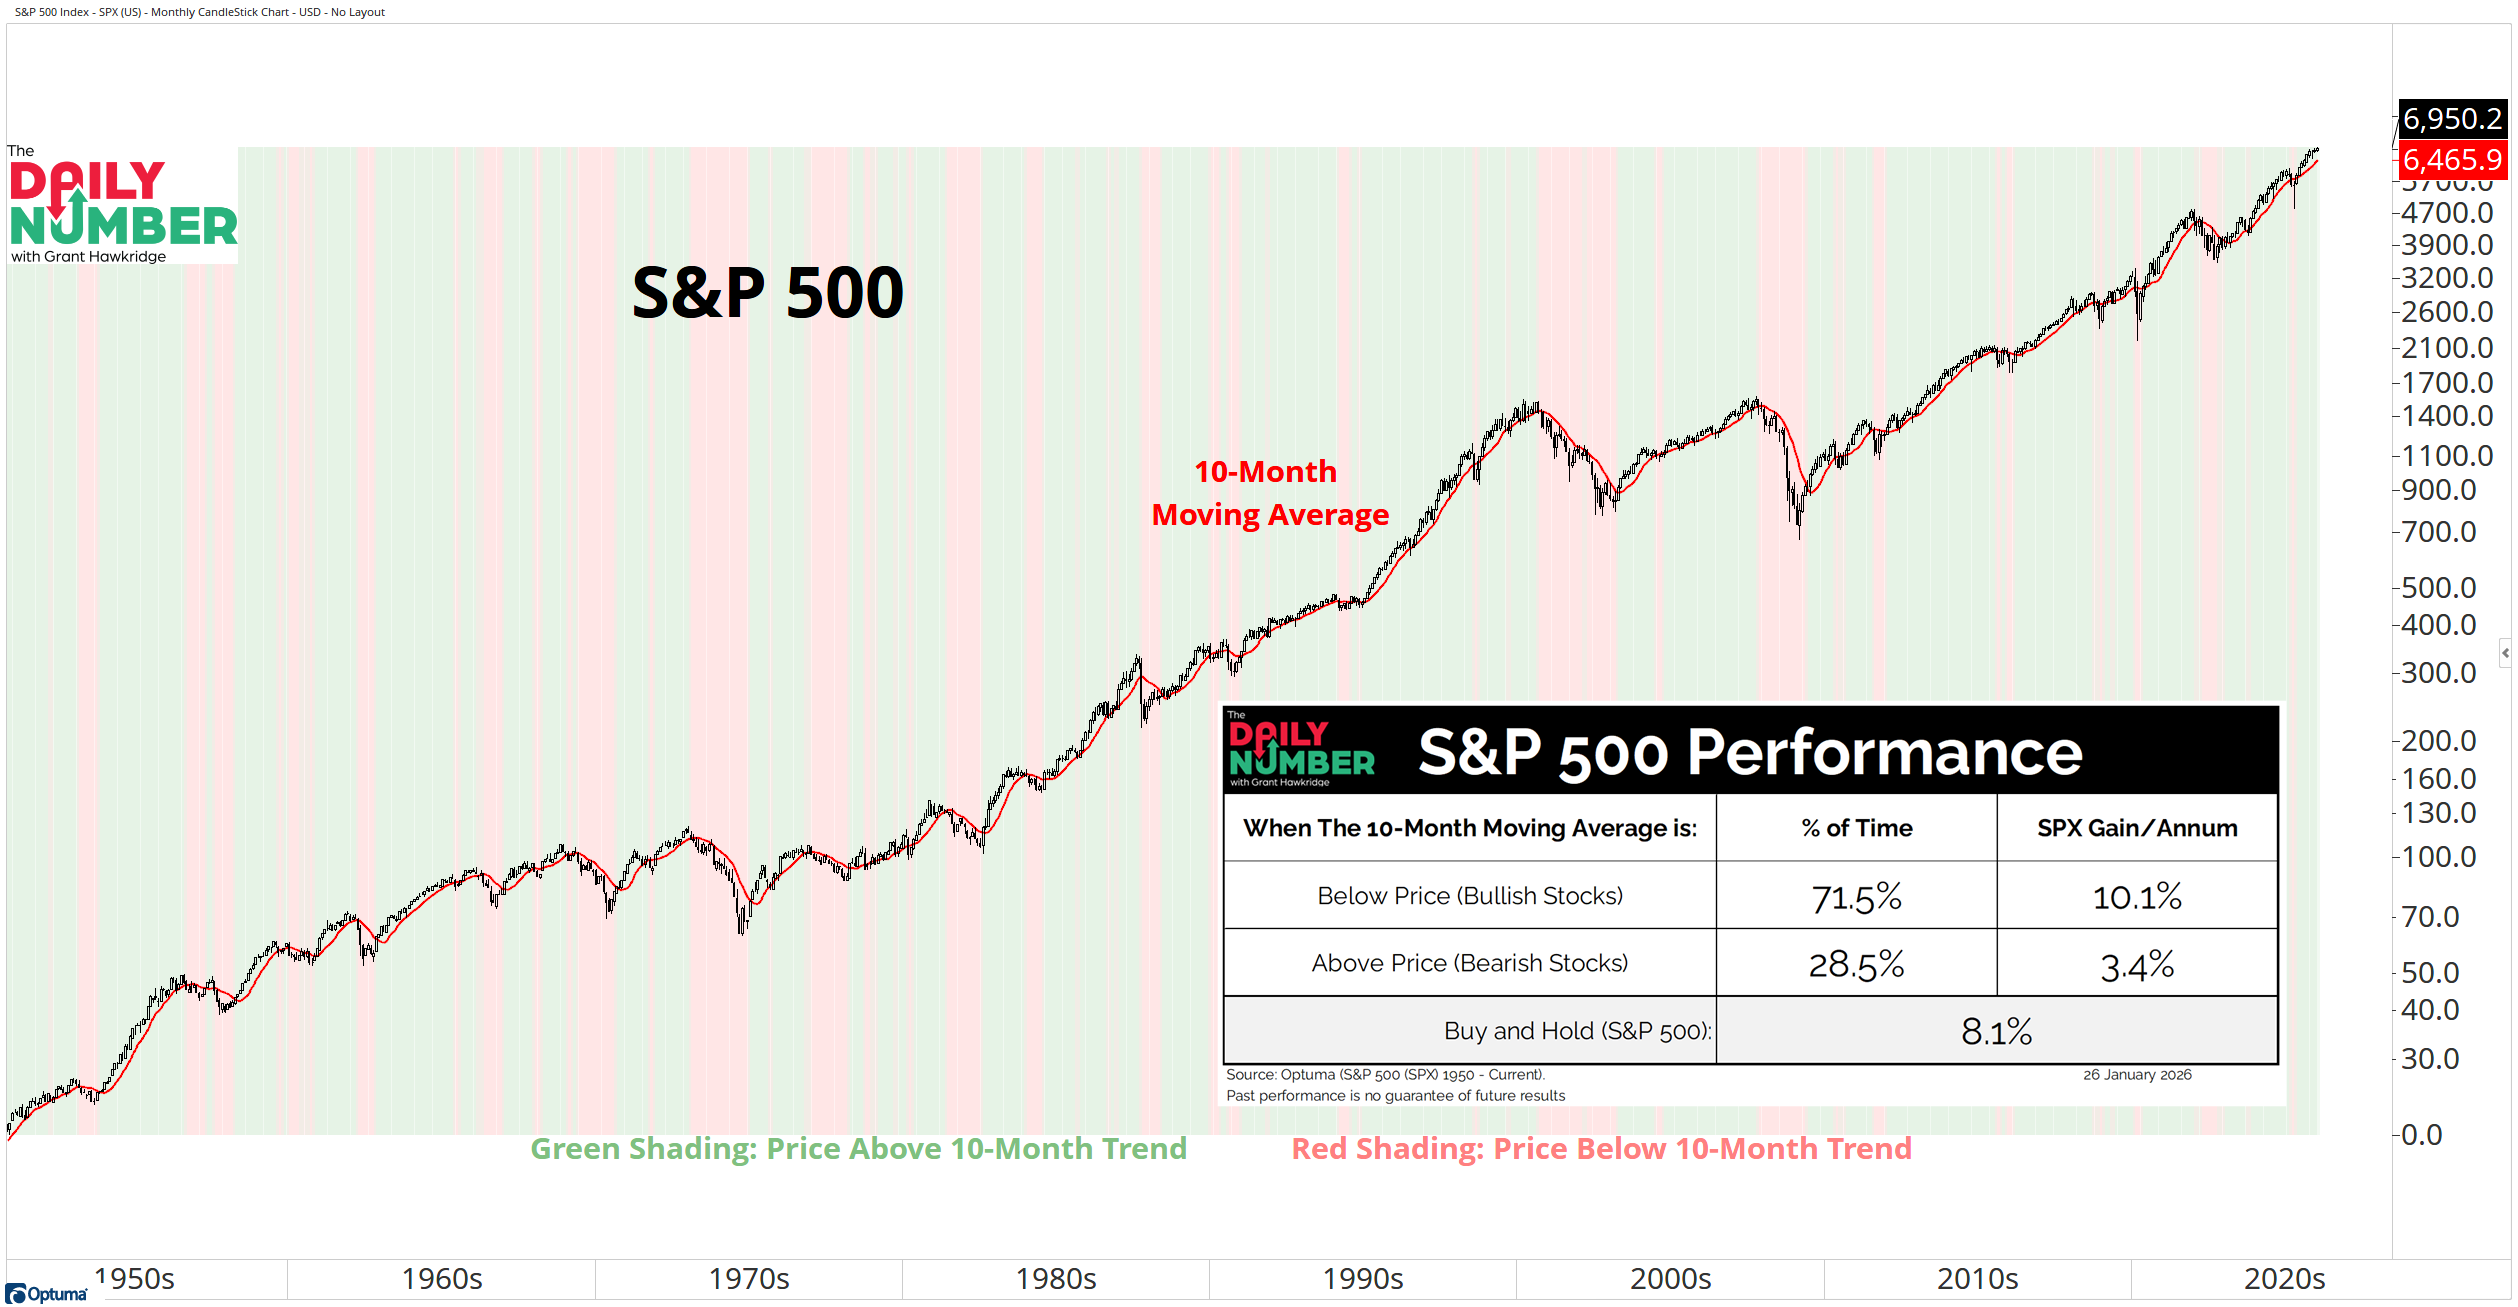
Let's break down what the chart shows:
The chart displays a monthly candlestick chart of the S&P 500 in black.
The red line is the 10-month moving average.
Green background shading shows periods when the price is above the 10-month moving average.
Red background shading shows periods when the price is below the 10-month moving average.
The Takeaway: The S&P 500 has spent 71.5% of its time above its 10-month moving average. In those periods, the index delivered an average annual gain of 10.1%. When price traded below it, returns dropped to 3.4%.
That gap is the whole point. Most of the upside happens when price stays above the trend.
This was one of the first rules I learned from JC. It stuck with me because it removes any type of debate. Above the long-term trend, you stay involved. Below it, you step aside.
Right now, price has stayed above the 10-month moving average for 27 months, and it is still 7.5% above that level. That defines the current trend. This is what an uptrend looks like.
And this is where most traders slip. They see how far price has come and decide it has gone too far. That is usually the moment they start fighting the trend.
I have three rules with trends, and they came directly from JC.
First, do not fight uptrends.
Second, if you are going to fight one anyway, you need real evidence. Feelings do not count.
Third, if you step in front of a trend, risk has to be tight. No exceptions. The market does not give extra chances.
This is not about catching tops or bottoms. It is about staying on the right side of the tape and not giving back time you cannot replace.
As long as price stays above the 10-month moving average, the trend stays intact.
If you find my content valuable, I would greatly appreciate it if you could share it with your friends, family, and colleagues. Your help in spreading the word is invaluable in supporting our work. Thank you to all of you who share!