Yesterday, the S&P 500 logged its 4th all-time high of 2026.
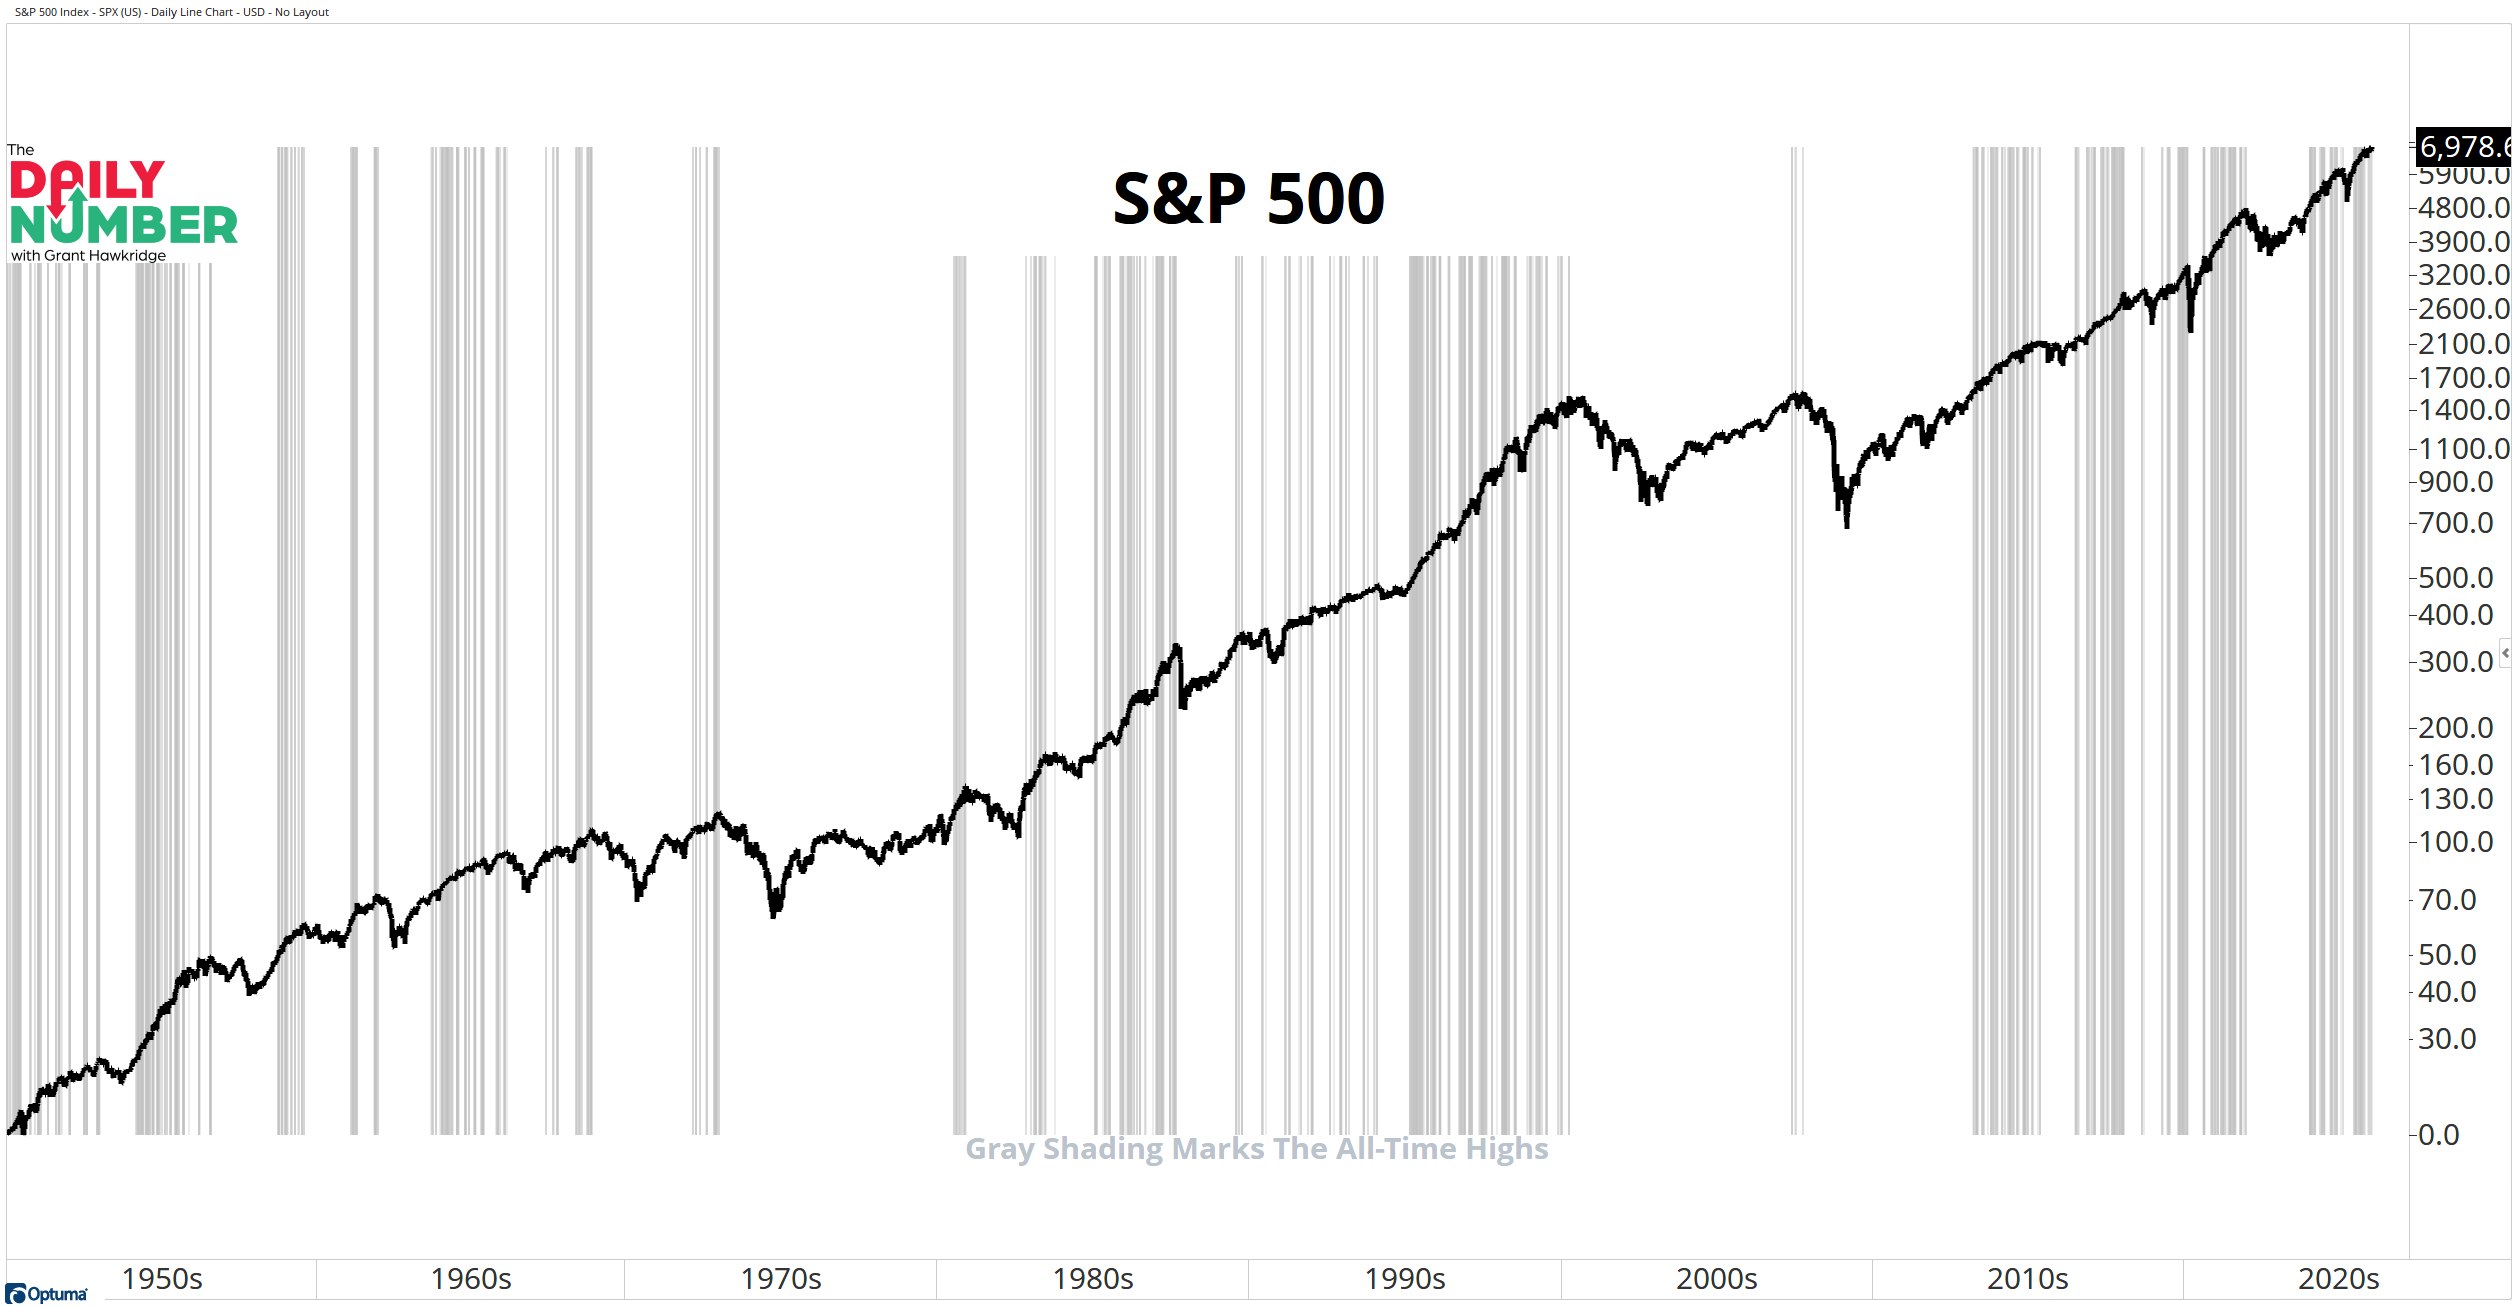
Here’s the chart:
Let's break down what the chart shows:
The chart displays the S&P 500 as a black line.
Vertical gray shading appears throughout the chart, marking periods when the index reached all-time highs.
The Takeaway: Four all-time highs this early tells you the bulls still have control of this market.
Since the 1950s, January averages 1.9 all-time highs. We are already past that level.
The S&P 500 averages 19.6 all-time highs per year going back to the 1950s. Strong years press higher, pause, then press again. New highs cluster when the bulls keep accepting higher prices.
All-time highs are not interruptions. The strongest uptrends are built while price holds near highs, not when it pulls away from them.
All-time highs make people uncomfortable. That discomfort gets mistaken for risk. In bull markets, that feeling is normal. It is the cost of staying with the trend.
Bull markets do not end because price is high. They end when the trend stops working. Fading new highs before that is a decision based on discomfort, not data. Price being high is not the risk.
What would tell you the bulls are no longer in control?
If you find my content valuable, I would greatly appreciate it if you could share it with your friends, family, and colleagues. Your help in spreading the word is invaluable in supporting our work. Thank you to all of you who share!