Two different trading environments, and this year is not last year’s market.
Here’s the chart:
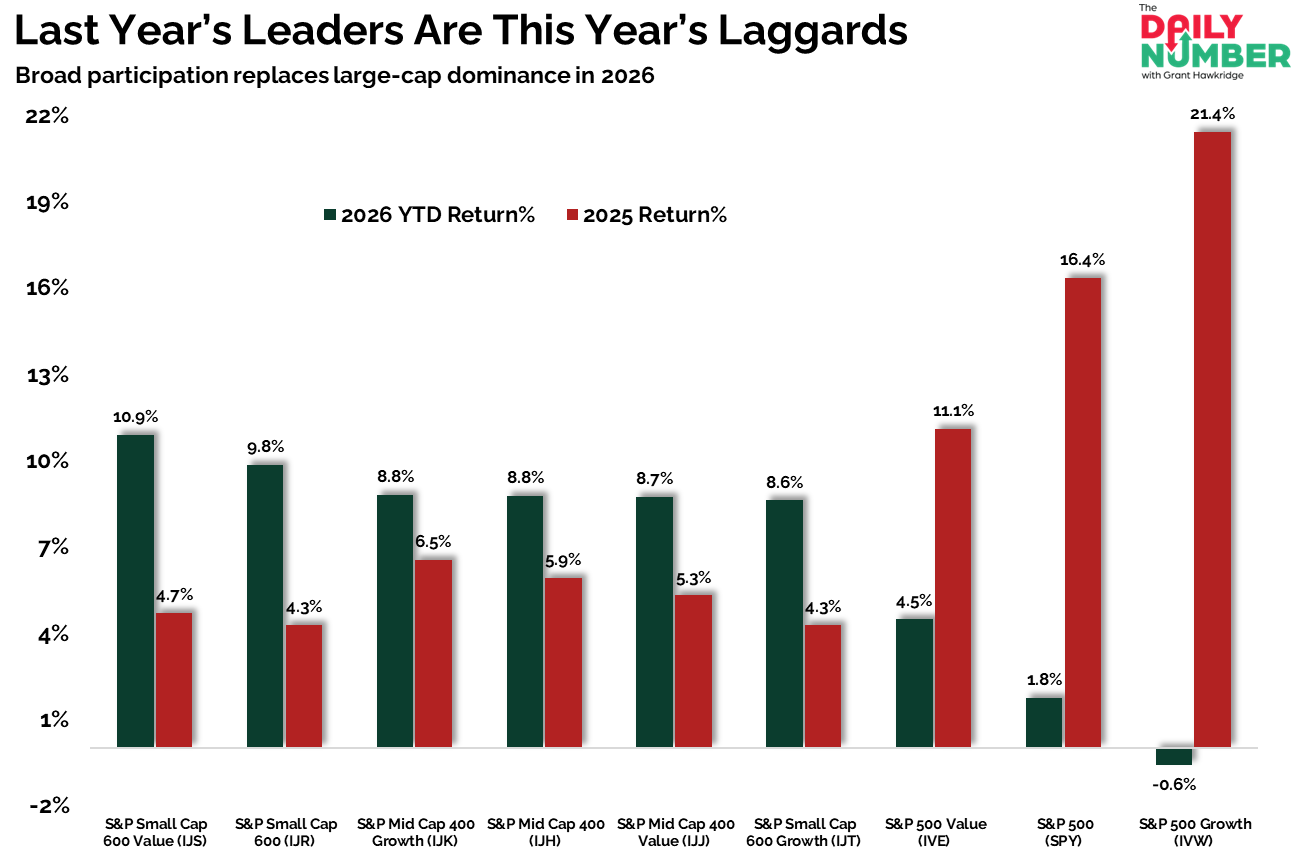
Let's break down what the chart shows:
The chart displays bar returns for multiple S&P indexes across two periods.
Green bars represent 2026 YTD returns.
Red bars represent full-year 2025 returns.
The Takeaway: 2025 was a size and Growth market. Large-cap Growth and the S&P 500 carried returns. Everything below them lagged. That was the environment.
2026 is different.
Leadership has rotated down the cap scale. Small-caps are leading outright. S&P 600 Value is up 10.9% YTD, with Core and Growth close behind. Risk is moving down the cap scale.
Mid-caps confirm the shift. All three S&P 400 styles sit near 8.8% YTD. No single style is leading. Everything is moving together.
Large-caps are now the laggards.
The S&P 500 is up only 1.8% YTD. The index is no longer telling the full story.
Large-cap Value is holding up better than Large-cap Growth, but it still trails every mid and small-cap group. Money is not hiding. It is moving.
This is the opposite of last year. 2025 rewarded size and concentration. 2026 is rewarding breadth and participation.
That is a change in the trading environment.
This is rotation, not risk-off. Money has stayed in equities. It just moved away from the most crowded trade.
So, are you positioned for this year’s market, or still trading last year’s leaders?
If you find my content valuable, I would greatly appreciate it if you could share it with your friends, family, and colleagues. Your help in spreading the word is invaluable in supporting our work. Thank you to all of you who share!