But like any healthy uptrend, it comes with corrective waves along the way.
Prices don’t move in a straight line forever — they need time to digest and pause from time to time.
And right now, things feel a bit extended in the short term.
That’s where seasonality comes in. It’s a great tool to help us identify the type of environment we’re likely heading into.
It’s one more piece of the intermarket puzzle we’re always putting together here at ASC.
That’s why it feels especially timely to bring up historical seasonal patterns right now.
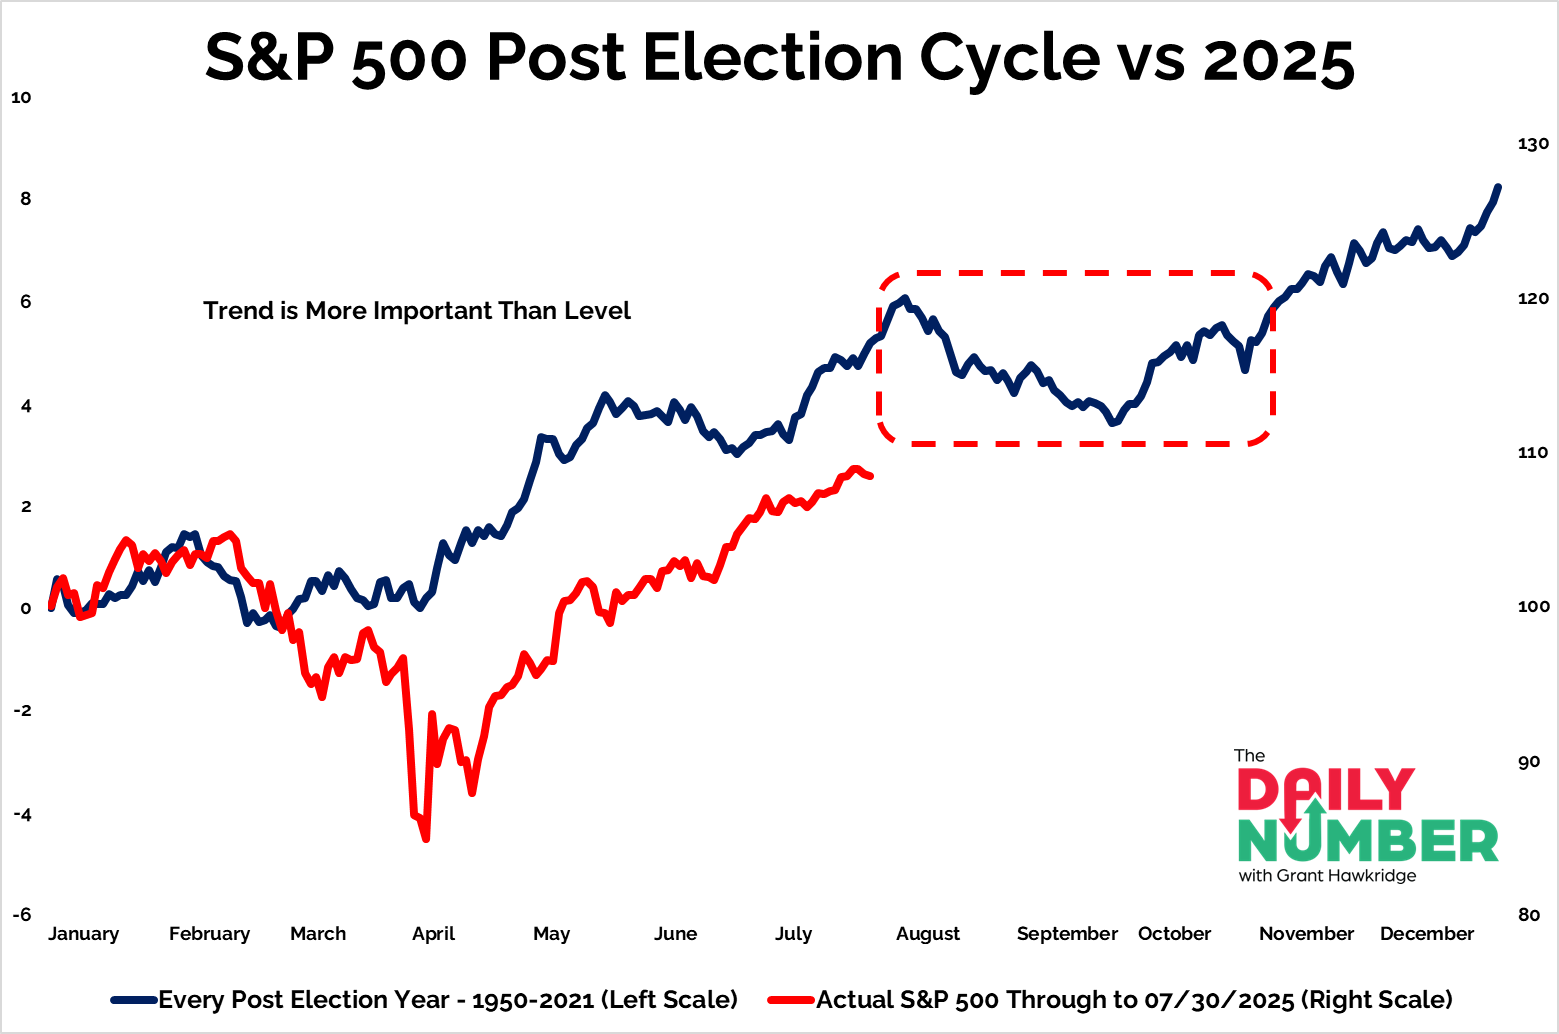
The chart below tracks the average S&P 500 performance during post-election years from 1950 to 2021 (in blue), compared to the actual performance in 2025 through July 30 (in red).
You can see how closely this year has followed the historical composite.
I wouldn’t be surprised to see some sideways, choppy action over the coming weeks — maybe even months — before things improve again toward the end of the year.
That’s where my head’s at right now, and it’s what we’ve seen throughout history.
Seasonality doesn’t predict the future — but this year, it’s lining up well with what we’ve already seen from stocks.
My friend Grant has been crushing the stats with his Daily Number note lately. It’s sharp, to the point, and packed with cool charts.
If you’re not already getting it in your inbox, you’re missing out.