Grant Hawkridge Thirty Stocks. Thirty Stories. One Index. 🧭 Today's number is... 30 30 Dow stocks are heading into the final weeks of the year, and they are not telling the same story. Here’s the table: Let's break down what the table shows:... December 16, 2025 Search Displaying 8233 - 8256 of 20080 JC Parets Helix Holdings Makes a $40 Million MLTX Buy The largest insider buy on today’s list comes in a Form 4 filing by Bihua Chen on behalf of Helix Holdings LLC. Helix revealed an additional purchase of $40 million in MoonLake... July 6, 2023 Stocks Strazza The Hot List JC Parets Swing Trader Pro: Morning Briefing (07-06-2023) From the Desk of Kimmy Sokoloff $SPY is consolidating up at the 440 level. Should we break it, we can see 438. The market is digesting the minutes from the June Fed meeting that were released yesterday, and... July 6, 2023 Stocks Swing Trader Pro Newsletter JC Parets Hot Corner Insider Weekly Strategy Session - July 5, 2023 This is the video recording of the July 5, 2023, Hot Corner Insider Weekly Strategy Session. July 6, 2023 Hot Corner Insider Stocks Strazza Inside Scoop Inside Scoop Strategy Session Inside Scoop Strategy Session Members Only JC Parets [Premium] Monthly Charts Strategy Session July 2023 This is the video recording of our July 5th Monthly Charts Live Strategy Session July 5, 2023 All Star Charts Premium Stocks Commodities Interest Rates Intermarktet Analysis Conference Call bonds ASC Video Members Only Alfonso De Pablos, CMT 2 to 100 Club (07-05-2023) From the Desk of Steve Strazza @Sstrazza Welcome to The 2 to 100 Club. As many of you know, something we've been working on internally is using various bottom-up tools and... July 5, 2023 All Star Charts Premium 2 to 100 Club Premium Stocks ASC 2-to-100 Club Grant Members Only Sean McLaughlin [Options] Looking For a Place to Stay Me and Steve Strazza are currently aboard an airplane to Singapore for the beginning of our 21-day trip throughout Southeast Asia. We're headed there to meet traders, chartists, and locals to learn how others approach risk. And one... July 5, 2023 All Options Options Premium ASC Ian Culley Buyers Brace for a Singapore Swing From the Desk of Ian Culley @IanCulley First stop, Singapore! Steve Strazza and Sean McLaughlin are headed east on a whirlwind... July 5, 2023 All Star Charts Premium Premium Currencies ASC Ian Currency Report Members Only Ian Culley GDX: Time To Buy the Dip? From the Desk of Ian Culley Healthy retest or failed breakout? These are the scenarios rolling through my mind as I watch the Gold Miners ETF $GDX. It’s easy to lean toward further weakness based on... July 5, 2023 All Star Charts Premium All Star Charts Gold Rush Premium ASC Gold Ian Gold Rush Members Only Patrick Dunuwila Daily Chart Report 📈 Wednesday, July 5, 2023 July 5, 2023 The Chart Report Daily Chart Report Front Top Content Featured Stories JC Parets Swing Trader Pro: Afternoon Briefing (07-05-2023) From the Desk of Kimmy Sokoloff It was a slow day today, as you might expect on a Wednesday after a Tuesday holiday in July, and I believe the rest of the week will... July 5, 2023 Stocks Swing Trader Pro Newsletter Steve Strazza The Hot Corner Insider (07-05-2023) From the Desk of Steve Strazza @Sstrazza and Alfonso Depablos @AlfChartsThe new highs list continues to grow as more and more stocks resolve higher from their consolidations.The word “rotation” is being thrown around a lot these... July 5, 2023 Hot Corner Insider Members Only Steve Strazza Hot Corner Insider Weekly Strategy Session – July 5, 2023 This is the video recording of the July 5, 2023, Hot Corner Insider Weekly Strategy Session. July 5, 2023 Hot Corner Insider Members Only Patrick Dunuwila Chart of the Day - Wednesday, July 05, 2023 July 5, 2023 The Chart Report Andrew Thrasher TCR Chart of the Day Volatility $VIX Ian Culley GDX: Time To Buy the Dip? From the Desk of Ian CulleyHealthy retest or failed breakout?These are the scenarios rolling through my mind as I watch the Gold Miners ETF $GDX.It’s easy to lean toward further weakness based on recent selling pressure... July 5, 2023 ASC Gold Rush Report Sean McLaughlin [Options P2P] New Position: XLK The next new position in our Paid-to-Play portfolio is: July 5, 2023 Options Paid to Play Paid To Play Members Only Alfonso De Pablos, CMT The Hot Corner Insider (07-05-2023) From the Desk of Steve Strazza @Sstrazza and Alfonso Depablos @AlfCharts The new highs list continues to grow as more and more stocks resolve higher from their consolidations. The word “rotation” is being thrown around a lot... July 5, 2023 Hot Corner Insider Stocks Strazza Alfonso Inside Scoop Members Only JC Parets Director LaRoche Reports an NHC Purchase Today’s Hot List is a short one. Director Richard F. LaRoche filed a Form 4 revealing a purchase of 2,100 shares of National HealthCare Corporation $NHC. July 5, 2023 Stocks Strazza The Hot List JC Parets Swing Trader Pro: Morning Briefing (07-05-2023) From the Desk of Kimmy Sokoloff The indices are lower this morning. We have the release of the minutes from the most recent Fed meeting at 2:00 p.m. ET. July 5, 2023 Stocks Swing Trader Pro Newsletter JC Parets Bitcoin & Ethereum New 52-week Highs More and more "things" keep making new highs. This is the sort of thing that happens in bull markets. You can see Ethereum and... July 4, 2023 Stocks ASC ASC Chart of the Day Alfonso De Pablos, CMT Follow the Flow (07-03-2023) From the Desk of Steve Strazza @sstrazza and Alfonso Depablos @Alfcharts This is one of our favorite bottom-up scans: Follow the Flow. In this note, we simply create a universe of stocks that experienced the most unusual options... July 3, 2023 All Star Charts Premium Premium Stocks ASC Strazza Follow The Flow Alfonso Members Only Steve Strazza The Minor Leaguers (07-03-2023) From the Desk of Steve Strazza @Sstrazza Welcome to our latest Minor Leaguers report. We've had some great trades come out of this small-cap-focused column since we launched it... July 3, 2023 All Star Charts Premium Premium Stocks ASC Strazza Minor Leaguers Grant Members Only JC Parets Swing Trader Pro: Afternoon Briefing (07-03-2023) From the Desk of Kimmy Sokoloff I pointed out in the Live Trading Room how the market might pop first thing in the morning then flatline. It did just that... July 3, 2023 Stocks Swing Trader Pro Newsletter Sean McLaughlin [Options P2P] Adjustment to XLY Position We've adjusted a position in the Paid-to-Play portfolio today: July 3, 2023 Options Paid to Play Paid To Play Members Only Patrick Dunuwila The Buzz 🐝 Week 18 Welcome to The Buzz! Week starting July 3, 2023 | Edition No. 18 Our mission at The Buzz is simple: to identify and profit from the most-talked-about stocks on social media. Every week, we compile a list... July 3, 2023 The Chart Report: Private Access Members Only Pagination Back 1 … Page 340 Page 341 Page 342 Page 343 Page 344 Page 345 Page 346 Page 347 Page 348 … 837 Next Recent Episodes Chart Request Live You Request It, We Break It Down. December 15, 2025 With special guest(s) Sam Gatlin Alfonso De Pablos, CMT The Long And Short Of It with Kenny Glick December 15th December 15, 2025 Hosted by Kenny Glick The Morning Show The King Of Seasonality December 15, 2025 Hosted by Spencer Israel JC Parets Steve Strazza With special guest(s) Kenny Glick Jeff Hirsch Sam Gatlin Thompson's Two Cents The Bull Markets Next Step December 12, 2025 Hosted by Larry Thompson The Morning Show It's Crypto Friday on The Morning Show December 12, 2025 Hosted by Spencer Israel JC Parets Steve Strazza With special guest(s) Kenny Glick Louis Sykes Larry Thompson Crypto After Dark The Most Ambitious Crypto Ever? December 11, 2025 Hosted by Louis Sykes Missed it? No problem!Replays of all our past episodes are always available in the episode archives. View Episode Archives
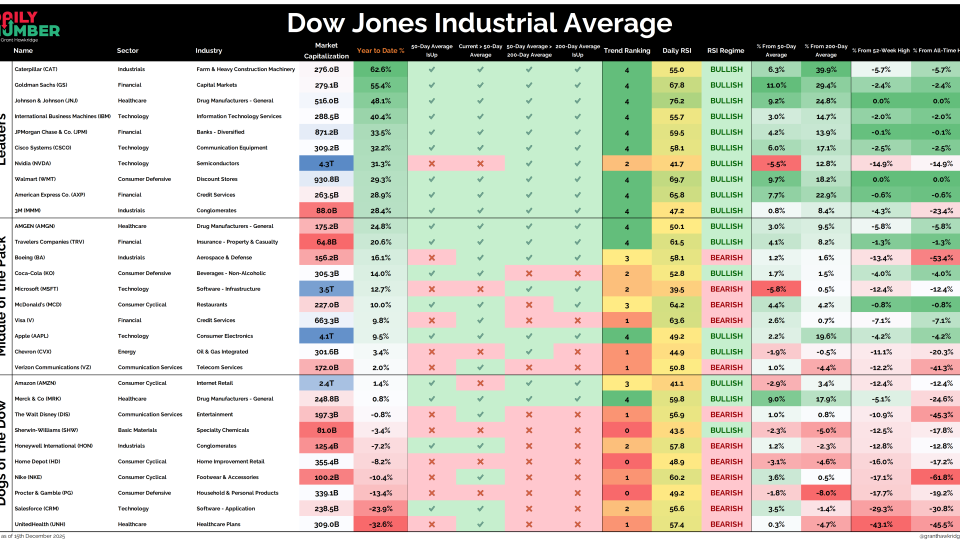
Grant Hawkridge Thirty Stocks. Thirty Stories. One Index. 🧭 Today's number is... 30 30 Dow stocks are heading into the final weeks of the year, and they are not telling the same story. Here’s the table: Let's break down what the table shows:... December 16, 2025
JC Parets Helix Holdings Makes a $40 Million MLTX Buy The largest insider buy on today’s list comes in a Form 4 filing by Bihua Chen on behalf of Helix Holdings LLC. Helix revealed an additional purchase of $40 million in MoonLake... July 6, 2023 Stocks Strazza The Hot List
JC Parets Swing Trader Pro: Morning Briefing (07-06-2023) From the Desk of Kimmy Sokoloff $SPY is consolidating up at the 440 level. Should we break it, we can see 438. The market is digesting the minutes from the June Fed meeting that were released yesterday, and... July 6, 2023 Stocks Swing Trader Pro Newsletter
JC Parets Hot Corner Insider Weekly Strategy Session - July 5, 2023 This is the video recording of the July 5, 2023, Hot Corner Insider Weekly Strategy Session. July 6, 2023 Hot Corner Insider Stocks Strazza Inside Scoop Inside Scoop Strategy Session Inside Scoop Strategy Session Members Only
JC Parets [Premium] Monthly Charts Strategy Session July 2023 This is the video recording of our July 5th Monthly Charts Live Strategy Session July 5, 2023 All Star Charts Premium Stocks Commodities Interest Rates Intermarktet Analysis Conference Call bonds ASC Video Members Only
Alfonso De Pablos, CMT 2 to 100 Club (07-05-2023) From the Desk of Steve Strazza @Sstrazza Welcome to The 2 to 100 Club. As many of you know, something we've been working on internally is using various bottom-up tools and... July 5, 2023 All Star Charts Premium 2 to 100 Club Premium Stocks ASC 2-to-100 Club Grant Members Only
Sean McLaughlin [Options] Looking For a Place to Stay Me and Steve Strazza are currently aboard an airplane to Singapore for the beginning of our 21-day trip throughout Southeast Asia. We're headed there to meet traders, chartists, and locals to learn how others approach risk. And one... July 5, 2023 All Options Options Premium ASC
Ian Culley Buyers Brace for a Singapore Swing From the Desk of Ian Culley @IanCulley First stop, Singapore! Steve Strazza and Sean McLaughlin are headed east on a whirlwind... July 5, 2023 All Star Charts Premium Premium Currencies ASC Ian Currency Report Members Only
Ian Culley GDX: Time To Buy the Dip? From the Desk of Ian Culley Healthy retest or failed breakout? These are the scenarios rolling through my mind as I watch the Gold Miners ETF $GDX. It’s easy to lean toward further weakness based on... July 5, 2023 All Star Charts Premium All Star Charts Gold Rush Premium ASC Gold Ian Gold Rush Members Only
Patrick Dunuwila Daily Chart Report 📈 Wednesday, July 5, 2023 July 5, 2023 The Chart Report Daily Chart Report Front Top Content Featured Stories
JC Parets Swing Trader Pro: Afternoon Briefing (07-05-2023) From the Desk of Kimmy Sokoloff It was a slow day today, as you might expect on a Wednesday after a Tuesday holiday in July, and I believe the rest of the week will... July 5, 2023 Stocks Swing Trader Pro Newsletter
Steve Strazza The Hot Corner Insider (07-05-2023) From the Desk of Steve Strazza @Sstrazza and Alfonso Depablos @AlfChartsThe new highs list continues to grow as more and more stocks resolve higher from their consolidations.The word “rotation” is being thrown around a lot these... July 5, 2023 Hot Corner Insider Members Only
Steve Strazza Hot Corner Insider Weekly Strategy Session – July 5, 2023 This is the video recording of the July 5, 2023, Hot Corner Insider Weekly Strategy Session. July 5, 2023 Hot Corner Insider Members Only
Patrick Dunuwila Chart of the Day - Wednesday, July 05, 2023 July 5, 2023 The Chart Report Andrew Thrasher TCR Chart of the Day Volatility $VIX
Ian Culley GDX: Time To Buy the Dip? From the Desk of Ian CulleyHealthy retest or failed breakout?These are the scenarios rolling through my mind as I watch the Gold Miners ETF $GDX.It’s easy to lean toward further weakness based on recent selling pressure... July 5, 2023 ASC Gold Rush Report
Sean McLaughlin [Options P2P] New Position: XLK The next new position in our Paid-to-Play portfolio is: July 5, 2023 Options Paid to Play Paid To Play Members Only
Alfonso De Pablos, CMT The Hot Corner Insider (07-05-2023) From the Desk of Steve Strazza @Sstrazza and Alfonso Depablos @AlfCharts The new highs list continues to grow as more and more stocks resolve higher from their consolidations. The word “rotation” is being thrown around a lot... July 5, 2023 Hot Corner Insider Stocks Strazza Alfonso Inside Scoop Members Only
JC Parets Director LaRoche Reports an NHC Purchase Today’s Hot List is a short one. Director Richard F. LaRoche filed a Form 4 revealing a purchase of 2,100 shares of National HealthCare Corporation $NHC. July 5, 2023 Stocks Strazza The Hot List
JC Parets Swing Trader Pro: Morning Briefing (07-05-2023) From the Desk of Kimmy Sokoloff The indices are lower this morning. We have the release of the minutes from the most recent Fed meeting at 2:00 p.m. ET. July 5, 2023 Stocks Swing Trader Pro Newsletter
JC Parets Bitcoin & Ethereum New 52-week Highs More and more "things" keep making new highs. This is the sort of thing that happens in bull markets. You can see Ethereum and... July 4, 2023 Stocks ASC ASC Chart of the Day
Alfonso De Pablos, CMT Follow the Flow (07-03-2023) From the Desk of Steve Strazza @sstrazza and Alfonso Depablos @Alfcharts This is one of our favorite bottom-up scans: Follow the Flow. In this note, we simply create a universe of stocks that experienced the most unusual options... July 3, 2023 All Star Charts Premium Premium Stocks ASC Strazza Follow The Flow Alfonso Members Only
Steve Strazza The Minor Leaguers (07-03-2023) From the Desk of Steve Strazza @Sstrazza Welcome to our latest Minor Leaguers report. We've had some great trades come out of this small-cap-focused column since we launched it... July 3, 2023 All Star Charts Premium Premium Stocks ASC Strazza Minor Leaguers Grant Members Only
JC Parets Swing Trader Pro: Afternoon Briefing (07-03-2023) From the Desk of Kimmy Sokoloff I pointed out in the Live Trading Room how the market might pop first thing in the morning then flatline. It did just that... July 3, 2023 Stocks Swing Trader Pro Newsletter
Sean McLaughlin [Options P2P] Adjustment to XLY Position We've adjusted a position in the Paid-to-Play portfolio today: July 3, 2023 Options Paid to Play Paid To Play Members Only
Patrick Dunuwila The Buzz 🐝 Week 18 Welcome to The Buzz! Week starting July 3, 2023 | Edition No. 18 Our mission at The Buzz is simple: to identify and profit from the most-talked-about stocks on social media. Every week, we compile a list... July 3, 2023 The Chart Report: Private Access Members Only
Chart Request Live You Request It, We Break It Down. December 15, 2025 With special guest(s) Sam Gatlin Alfonso De Pablos, CMT
The Morning Show The King Of Seasonality December 15, 2025 Hosted by Spencer Israel JC Parets Steve Strazza With special guest(s) Kenny Glick Jeff Hirsch Sam Gatlin
The Morning Show It's Crypto Friday on The Morning Show December 12, 2025 Hosted by Spencer Israel JC Parets Steve Strazza With special guest(s) Kenny Glick Louis Sykes Larry Thompson