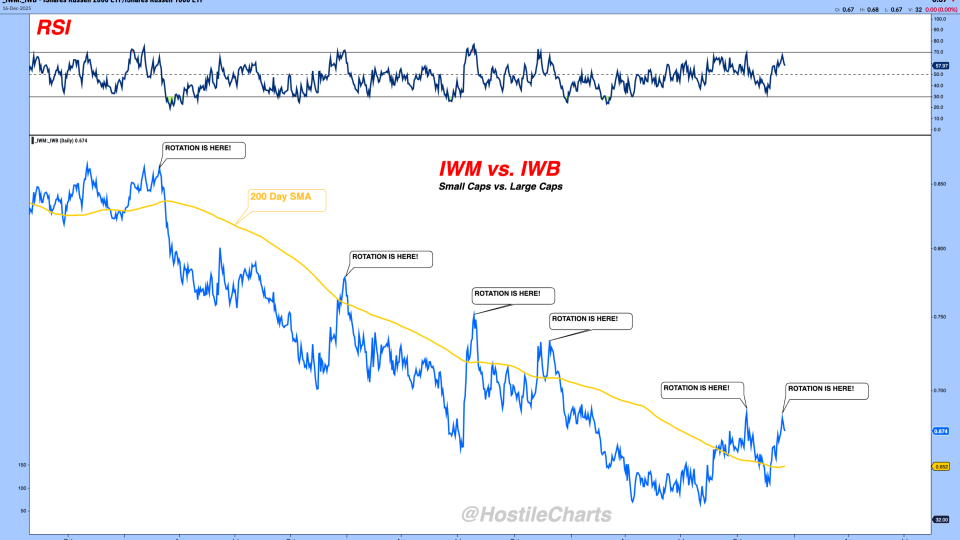
Larry Thompson Rotation is Here Just Kidding..... Everyone loves a good underdog story. I get it. But the obsession with small caps “finally taking over” every time they outperform for a few days still blows my mind. Two or three times a year, small caps catch a bid. Large caps... December 16, 2025 Search Displaying 8449 - 8472 of 20091 JC Parets Swing Trader Pro: Morning Briefing (06-07-2023) From the Desk of Kimmy Sokoloff The indices are kind of flat this morning. Yesterday there was a lot of movement in names, names that haven't moved in quite some time. June 7, 2023 Stocks Swing Trader Pro Newsletter Ian Culley Forex Markets Suggest More Pain at the Pump From the Desk of Ian Culley @IanCulley Petrocurrencies and crude oil futures are diverging. The currencies that benefit most from higher oil prices refuse to roll with crude’s steady decline. Perhaps it’s more about the... June 6, 2023 All Star Charts Premium Premium Currencies ASC Ian Currency Report Members Only Patrick Dunuwila Daily Chart Report 📈 Tuesday, June 6, 2023 June 6, 2023 The Chart Report Daily Chart Report Front Top Content Featured Stories JC Parets Swing Trader Pro: Afternoon Briefing (06-06-2023) From the Desk of Kimmy Sokoloff $IWM led the pack today, up almost 3%. Banks started to rally as well. Time will tell if this... June 6, 2023 Stocks Swing Trader Pro Newsletter Patrick Dunuwila Chart of the Day - Tuesday, June 6, 2023 June 6, 2023 The Chart Report Breadth Russell 2000 TCR Chart of the Day $IWM Katie Stockton Sean McLaughlin [Options P2P] New Position: XHB The next new position in our Paid-to-Play portfolio is: June 6, 2023 Options Paid to Play Paid To Play Members Only JC Parets Artal Group Buys 28 Million LXRX Shares The largest insider buy on today's list comes in a Form 4 filing by Artal Group SA. The firm reported a purchase of 27,775,050 shares, equivalent to $72.2 million in Lexicon Pharmaceuticals, Inc. $LXRX. June 6, 2023 Stocks Strazza The Hot List JC Parets Swing Trader Pro: Morning Briefing (06-06-2023) From the Desk of Kimmy Sokoloff We just about hit the 4,300 mark on the S&P 500. A healthy pull-in here would be optimal. June 6, 2023 Stocks Swing Trader Pro Newsletter JC Parets [Premium] Monthly Charts Strategy Session June 2023 This is the video recording of our June 5th Monthly Charts Live Strategy Session June 5, 2023 All Star Charts Premium Stocks Currencies Commodities Interest Rates Intermarktet Analysis Conference Call ASC seasonality sentiment Video Members Only Ian Culley Don’t Wait for Gold To Break Out: Buy Silver Mining Stocks From the Desk of Ian Culley @IanCulley What will it take for gold to make new all-time highs? A weaker US dollar and falling real yields... June 5, 2023 All Star Charts Premium All Star Charts Gold Rush Premium ASC Gold Ian Gold Rush Members Only Alfonso De Pablos, CMT The Minor Leaguers (06-05-2023) From the Desk of Steve Strazza @Sstrazza Welcome to The Minor Leaguers. We've had some great trades come out of this small-cap-focused column since we launched it back in 2020 and... June 5, 2023 All Star Charts Premium Premium Stocks ASC Strazza Minor Leaguers Members Only Alfonso De Pablos, CMT Follow the Flow (06-05-2023) From the Desk of Steve Strazza @sstrazza and Alfonso Depablos @Alfcharts This is one of our favorite bottom-up scans: Follow the Flow. In this note, we simply create a universe of stocks that experienced the most unusual options... June 5, 2023 All Star Charts Premium Premium Stocks ASC Strazza Follow The Flow Alfonso Members Only Patrick Dunuwila Daily Chart Report 📈 Monday, June 5, 2023 June 5, 2023 The Chart Report Daily Chart Report Front Top Content Featured Stories JC Parets Swing Trader Pro: Afternoon Briefing (06-05-2023) From the Desk of Kimmy Sokoloff That was a very slow day, with a healthy contraction in the afternoon. $SPY is sitting outside the Bollinger... June 5, 2023 Stocks Swing Trader Pro Newsletter Patrick Dunuwila Chart of the Day - Monday, June 5, 2023 June 5, 2023 The Chart Report Bitcoin Cryptocurrencies TCR Chart of the Day Brian Lund Ian Culley Don’t Wait for Gold To Break Out: Buy Silver Mining Stocks From the Desk of Ian Culley @IanCulleyWhat will it take for gold to make new all-time highs?A weaker US dollar and falling real yields are likely candidates for leading catalysts.We can also add a significant unwind in... June 5, 2023 ASC Gold Rush Report Sean McLaughlin [Options Premium] Tracking to the Sun It appears to me the broader markets have declared their intention to rally this summer. As such, I want to be positioned to take advantage. And what better way to position for a summer rally than in a company with exposure to solar energy... June 5, 2023 All Star Options Options Options Premium Members Only Sean McLaughlin [Options P2P] Trade Alert: Closed XLP for Profit We had a resting GTC order filled at our profit target in the Paid-to-Play portfolio today: June 5, 2023 Options Paid to Play Paid To Play Members Only Sean McLaughlin [Options P2P] New Position: KRE The next new position in our Paid-to-Play portfolio is: June 5, 2023 Options Paid to Play Paid To Play Members Only JC Parets Loews SVP Tisch Reports a Large Insider Buy The largest insider buy on today's list comes in a Form 4 filing by Ben Tisch, senior vice president of corporate development and strategy at Loews Corporation $L. Tisch reported a purchase of 330,000 shares, equivalent to $18,781,400. June 5, 2023 Stocks Strazza The Hot List JC Parets Swing Trader Pro: Morning Briefing (06-05-2023) From the Desk of Kimmy Sokoloff The S&P 500 almost touched the 4,300 mark, and we're becoming a tad bit extended. A lot of names that have been dead wood finally started to come to life on Friday. We'll see if that... June 5, 2023 Stocks Swing Trader Pro Newsletter Patrick Dunuwila The Buzz 🐝 Week 14 Welcome to The Buzz! Week starting June 5, 2023 | Edition No. 14 Our mission at The Buzz is simple: to identify and profit from the most-talked-about stocks on social media. Every week, we compile a list... June 5, 2023 The Chart Report: Private Access Members Only JC Parets [Video] Fox Business: Bull Market Rotation Thursday morning I was in New York City chatting with Maria Bartiromo about the ongoing Bull Market in Stocks. Maria and I have been talking about this topic pretty regularly since she... June 4, 2023 Stocks Television youtube ASC Video Alfonso De Pablos, CMT Saturday Morning Chartoons: New Highs List Getting Longer This is the weekly post that aggregates all the charts we put together throughout the week and organizes them all into one, easy to flip through deck. June 3, 2023 All Star Charts Premium ASC Chartoons Members Only Pagination Back 1 … Page 349 Page 350 Page 351 Page 352 Page 353 Page 354 Page 355 Page 356 Page 357 … 838 Next Recent Episodes The Long And Short Of It with Kenny Glick December 16th December 16, 2025 Hosted by Kenny Glick The Open Bar Let's Put Some Money To Work December 16, 2025 Hosted by Steve Strazza The Morning Show Algo Trading With Michael Nauss December 16, 2025 Hosted by Spencer Israel JC Parets Steve Strazza With special guest(s) Kenny Glick Michael Nauss, CMT Chart Request Live You Request It, We Break It Down. December 15, 2025 With special guest(s) Sam Gatlin Alfonso De Pablos, CMT The Long And Short Of It with Kenny Glick December 15th December 15, 2025 Hosted by Kenny Glick The Morning Show The King Of Seasonality December 15, 2025 Hosted by Spencer Israel JC Parets Steve Strazza With special guest(s) Kenny Glick Jeff Hirsch Sam Gatlin Missed it? No problem!Replays of all our past episodes are always available in the episode archives. View Episode Archives
Larry Thompson Rotation is Here Just Kidding..... Everyone loves a good underdog story. I get it. But the obsession with small caps “finally taking over” every time they outperform for a few days still blows my mind. Two or three times a year, small caps catch a bid. Large caps... December 16, 2025
JC Parets Swing Trader Pro: Morning Briefing (06-07-2023) From the Desk of Kimmy Sokoloff The indices are kind of flat this morning. Yesterday there was a lot of movement in names, names that haven't moved in quite some time. June 7, 2023 Stocks Swing Trader Pro Newsletter
Ian Culley Forex Markets Suggest More Pain at the Pump From the Desk of Ian Culley @IanCulley Petrocurrencies and crude oil futures are diverging. The currencies that benefit most from higher oil prices refuse to roll with crude’s steady decline. Perhaps it’s more about the... June 6, 2023 All Star Charts Premium Premium Currencies ASC Ian Currency Report Members Only
Patrick Dunuwila Daily Chart Report 📈 Tuesday, June 6, 2023 June 6, 2023 The Chart Report Daily Chart Report Front Top Content Featured Stories
JC Parets Swing Trader Pro: Afternoon Briefing (06-06-2023) From the Desk of Kimmy Sokoloff $IWM led the pack today, up almost 3%. Banks started to rally as well. Time will tell if this... June 6, 2023 Stocks Swing Trader Pro Newsletter
Patrick Dunuwila Chart of the Day - Tuesday, June 6, 2023 June 6, 2023 The Chart Report Breadth Russell 2000 TCR Chart of the Day $IWM Katie Stockton
Sean McLaughlin [Options P2P] New Position: XHB The next new position in our Paid-to-Play portfolio is: June 6, 2023 Options Paid to Play Paid To Play Members Only
JC Parets Artal Group Buys 28 Million LXRX Shares The largest insider buy on today's list comes in a Form 4 filing by Artal Group SA. The firm reported a purchase of 27,775,050 shares, equivalent to $72.2 million in Lexicon Pharmaceuticals, Inc. $LXRX. June 6, 2023 Stocks Strazza The Hot List
JC Parets Swing Trader Pro: Morning Briefing (06-06-2023) From the Desk of Kimmy Sokoloff We just about hit the 4,300 mark on the S&P 500. A healthy pull-in here would be optimal. June 6, 2023 Stocks Swing Trader Pro Newsletter
JC Parets [Premium] Monthly Charts Strategy Session June 2023 This is the video recording of our June 5th Monthly Charts Live Strategy Session June 5, 2023 All Star Charts Premium Stocks Currencies Commodities Interest Rates Intermarktet Analysis Conference Call ASC seasonality sentiment Video Members Only
Ian Culley Don’t Wait for Gold To Break Out: Buy Silver Mining Stocks From the Desk of Ian Culley @IanCulley What will it take for gold to make new all-time highs? A weaker US dollar and falling real yields... June 5, 2023 All Star Charts Premium All Star Charts Gold Rush Premium ASC Gold Ian Gold Rush Members Only
Alfonso De Pablos, CMT The Minor Leaguers (06-05-2023) From the Desk of Steve Strazza @Sstrazza Welcome to The Minor Leaguers. We've had some great trades come out of this small-cap-focused column since we launched it back in 2020 and... June 5, 2023 All Star Charts Premium Premium Stocks ASC Strazza Minor Leaguers Members Only
Alfonso De Pablos, CMT Follow the Flow (06-05-2023) From the Desk of Steve Strazza @sstrazza and Alfonso Depablos @Alfcharts This is one of our favorite bottom-up scans: Follow the Flow. In this note, we simply create a universe of stocks that experienced the most unusual options... June 5, 2023 All Star Charts Premium Premium Stocks ASC Strazza Follow The Flow Alfonso Members Only
Patrick Dunuwila Daily Chart Report 📈 Monday, June 5, 2023 June 5, 2023 The Chart Report Daily Chart Report Front Top Content Featured Stories
JC Parets Swing Trader Pro: Afternoon Briefing (06-05-2023) From the Desk of Kimmy Sokoloff That was a very slow day, with a healthy contraction in the afternoon. $SPY is sitting outside the Bollinger... June 5, 2023 Stocks Swing Trader Pro Newsletter
Patrick Dunuwila Chart of the Day - Monday, June 5, 2023 June 5, 2023 The Chart Report Bitcoin Cryptocurrencies TCR Chart of the Day Brian Lund
Ian Culley Don’t Wait for Gold To Break Out: Buy Silver Mining Stocks From the Desk of Ian Culley @IanCulleyWhat will it take for gold to make new all-time highs?A weaker US dollar and falling real yields are likely candidates for leading catalysts.We can also add a significant unwind in... June 5, 2023 ASC Gold Rush Report
Sean McLaughlin [Options Premium] Tracking to the Sun It appears to me the broader markets have declared their intention to rally this summer. As such, I want to be positioned to take advantage. And what better way to position for a summer rally than in a company with exposure to solar energy... June 5, 2023 All Star Options Options Options Premium Members Only
Sean McLaughlin [Options P2P] Trade Alert: Closed XLP for Profit We had a resting GTC order filled at our profit target in the Paid-to-Play portfolio today: June 5, 2023 Options Paid to Play Paid To Play Members Only
Sean McLaughlin [Options P2P] New Position: KRE The next new position in our Paid-to-Play portfolio is: June 5, 2023 Options Paid to Play Paid To Play Members Only
JC Parets Loews SVP Tisch Reports a Large Insider Buy The largest insider buy on today's list comes in a Form 4 filing by Ben Tisch, senior vice president of corporate development and strategy at Loews Corporation $L. Tisch reported a purchase of 330,000 shares, equivalent to $18,781,400. June 5, 2023 Stocks Strazza The Hot List
JC Parets Swing Trader Pro: Morning Briefing (06-05-2023) From the Desk of Kimmy Sokoloff The S&P 500 almost touched the 4,300 mark, and we're becoming a tad bit extended. A lot of names that have been dead wood finally started to come to life on Friday. We'll see if that... June 5, 2023 Stocks Swing Trader Pro Newsletter
Patrick Dunuwila The Buzz 🐝 Week 14 Welcome to The Buzz! Week starting June 5, 2023 | Edition No. 14 Our mission at The Buzz is simple: to identify and profit from the most-talked-about stocks on social media. Every week, we compile a list... June 5, 2023 The Chart Report: Private Access Members Only
JC Parets [Video] Fox Business: Bull Market Rotation Thursday morning I was in New York City chatting with Maria Bartiromo about the ongoing Bull Market in Stocks. Maria and I have been talking about this topic pretty regularly since she... June 4, 2023 Stocks Television youtube ASC Video
Alfonso De Pablos, CMT Saturday Morning Chartoons: New Highs List Getting Longer This is the weekly post that aggregates all the charts we put together throughout the week and organizes them all into one, easy to flip through deck. June 3, 2023 All Star Charts Premium ASC Chartoons Members Only
The Morning Show Algo Trading With Michael Nauss December 16, 2025 Hosted by Spencer Israel JC Parets Steve Strazza With special guest(s) Kenny Glick Michael Nauss, CMT
Chart Request Live You Request It, We Break It Down. December 15, 2025 With special guest(s) Sam Gatlin Alfonso De Pablos, CMT
The Morning Show The King Of Seasonality December 15, 2025 Hosted by Spencer Israel JC Parets Steve Strazza With special guest(s) Kenny Glick Jeff Hirsch Sam Gatlin