Larry Thompson Rotation is Here Just Kidding..... Everyone loves a good underdog story. I get it. But the obsession with small caps “finally taking over” every time they outperform for a few days still blows my mind. Two or three times a year, small caps catch a bid. Large caps... December 16, 2025 Search Displaying 9265 - 9288 of 20091 JC Parets Swing Trader Pro: Afternoon Briefing (02-23-2023) From the Desk of Kimmy Sokoloff This morning the market popped. Then it faded most of the day until about 1:00 p.m. ET, when the rally started, right off of... February 23, 2023 Stocks Swing Trader Pro Newsletter JC Parets [PLUS] Weekly Town Hall w/ Willie Delwiche This is the video recording of the February 23rd, 2023, Weekly Town Hall w/ Willie Delwiche. 2/23/23 2:00 PM ET February 23, 2023 willie plus town hall meeting Sean McLaughlin [Options P2P] Trade Alert: Exited XLI at Profit Target We had a resting GTC order filled at our profit target in the Paid-to-Play portfolio today: February 23, 2023 Options Paid to Play Paid To Play Members Only Sean McLaughlin [Options P2P] Trade Alert: Exited XLK Position We had a resting GTC order filled in the Paid-to-Play portfolio today: February 23, 2023 Options Paid to Play Paid To Play Members Only Patrick Dunuwila Chart of the Day - Thursday, February 23rd, 2023 February 23, 2023 The Chart Report TCR Chart of the Day $DXY US Dollar Greg Rieben Sean McLaughlin [Options P2P] Adjustment to XRT Position We've adjusted a position in the Paid-to-Play portfolio today: February 23, 2023 Options Paid to Play Paid To Play Members Only Ian Culley [Video] What the FICC?: Monitoring the Dollar Bounce It's the weekly currency edition of What the FICC? It’s victory at sea across currency markets. But it's not stopping the US dollar from cutting through the chop... Check it out! February 23, 2023 Currencies youtube ASC Ian Currency Report Video Louis Sykes Relative Strength: The Most Underrated Indicator The most underrated element of technical analysis has to be relative strength. It's impossible to outperform your benchmark if you own assets that are underperforming. Much of this work is grounded in the overarching notion that asset... February 23, 2023 ASC Crypto JC Parets CFO Erceg Reports an NWL Purchase The most significant insider transaction on today's Hot List is a Form 4 filing by Mark J. Erceg, the CFO of Newell Brands Inc $NWL. Erceg reported a purchase of $999,833 in NWL. February 23, 2023 Stocks Strazza The Hot List JC Parets Swing Trader Pro: Morning Briefing (02-23-2023) From the Desk of Kimmy Sokoloff As I write this note, the only reason the market is up is because of $NVDA’s earnings. We have GDP today, and that might change the tune. Hopefully, we continue to hold... February 23, 2023 Stocks Swing Trader Pro Newsletter Steve Strazza The Short Report (02-22-2023) From the Desk of Steve Strazza @Sstrazza When investing in the stock market, we always want to approach it as "a market of stocks." Regardless of the environment, there are always stocks showing leadership and trending higher... February 22, 2023 All Star Charts Premium Premium Stocks ASC Strazza Grant Short Report Members Only Patrick Dunuwila Daily Chart Report ? Wednesday, February 22nd, 2023 February 22, 2023 The Chart Report Daily Chart Report Front Top Content Featured Stories JC Parets [PLUS] Weekly Sentiment Report: A Dose of Buyer’s Remorse? From the Desk of Willie Delwiche The NAAIM exposure index surpassed its August high last month and has been on... February 22, 2023 willie plus sentiment Sentiment Report JC Parets Swing Trader Pro: Afternoon Briefing (02-22-2023) From the Desk of Kimmy Sokoloff $SPY struggled all day to stay above the 400 level. Now we have support at 396.76. If we break that, we can... February 22, 2023 Stocks Swing Trader Pro Newsletter Ian Culley Breaking the Dollar Down with One Chart From the Desk of Ian Culley @IanCulley Challenging conditions prevail across currency markets. It’s victory at sea! But that’s not stopping the ... February 22, 2023 All Star Charts Premium Currencies ASC Ian Currency Report Members Only Patrick Dunuwila Chart of the Day - Wednesday, February 22nd, 2023 February 22, 2023 The Chart Report $SPX S&P 500 TCR Chart of the Day $SPY Andy Moss Sean McLaughlin [Options] Building Premium Homes Slippery markets make for rising options premiums. And one sector ETF is currently rising head and shoulders above the rest, offering some juicy premiums for us to sell into along with a wide risk management band for us to dance in. So let's... February 22, 2023 All Options Options Premium ASC Louis Sykes Respecting the Risks Equities had their worst session of the year yesterday, as the S&P 500 retraced 2% during the day. This comes as rates and the US dollar push higher, with the yield on the 10-year US Treasury note making fresh three-month highs. ... February 22, 2023 All Star Charts Crypto Crypto Crypto Blog Members Only Sean McLaughlin [Options P2P] Adjustment to GDXJ Position We've adjusted a position in the Paid-to-Play portfolio today: February 22, 2023 Options Paid to Play Paid To Play Members Only JC Parets Swing Trader Pro: Morning Briefing (02-22-2023) From the Desk of Kimmy Sokoloff We've got FOMC minutes coming today, so let's be on our toes. We still run the risk that the $SPX can head down to 3,950. February 22, 2023 Stocks Swing Trader Pro Newsletter JC Parets Abdiel Capital Is Buying More APPN The largest insider transaction on today’s list is a Form 4 filing by Abdiel Capital Advisors. Abdiel revealed a purchase of $4.5 million in Appian Corporation $APPN. February 22, 2023 Stocks Strazza The Hot List JC Parets [Premium] Mid-Month Conference Call Video Recording February 2023 This is the video recording of the February 2023 Mid-month Conference Call. February 22, 2023 All Star Charts Premium Stocks Conference Call ASC Video Members Only Ian Culley [Video] Gold Rush: The Search for Relative Strength The stage is set for an epic rally. The catalysts are in place. Yet messy conditions persist as we await ignition and blast off. Regardless, we can use the current environment to find the most buoyant and promising names. Check it... February 21, 2023 All Star Charts Premium All Star Charts Gold Rush Premium ASC Gold Ian Gold Rush Video Members Only Ian Culley Gold Mining Stocks and the Beachball Effect From the Desk of Ian Culley @IanCulley With the dollar beginning to rise, gold and silver are coming under some selling pressure. Nevertheless, these shiny rocks and their related mining stocks are hanging tough. Instead... February 21, 2023 All Star Charts Premium All Star Charts Gold Rush Premium Commodities ASC Gold Ian Gold Rush Members Only Pagination Back 1 … Page 383 Page 384 Page 385 Page 386 Page 387 Page 388 Page 389 Page 390 Page 391 … 838 Next Recent Episodes The Long And Short Of It with Kenny Glick December 16th December 16, 2025 Hosted by Kenny Glick The Open Bar Let's Put Some Money To Work December 16, 2025 Hosted by Steve Strazza Algo Trading With Michael Nauss December 16, 2025 Chart Request Live You Request It, We Break It Down. December 15, 2025 With special guest(s) Sam Gatlin Alfonso De Pablos, CMT The Long And Short Of It with Kenny Glick December 15th December 15, 2025 Hosted by Kenny Glick The King Of Seasonality December 15, 2025 Missed it? No problem!Replays of all our past episodes are always available in the episode archives. View Episode Archives
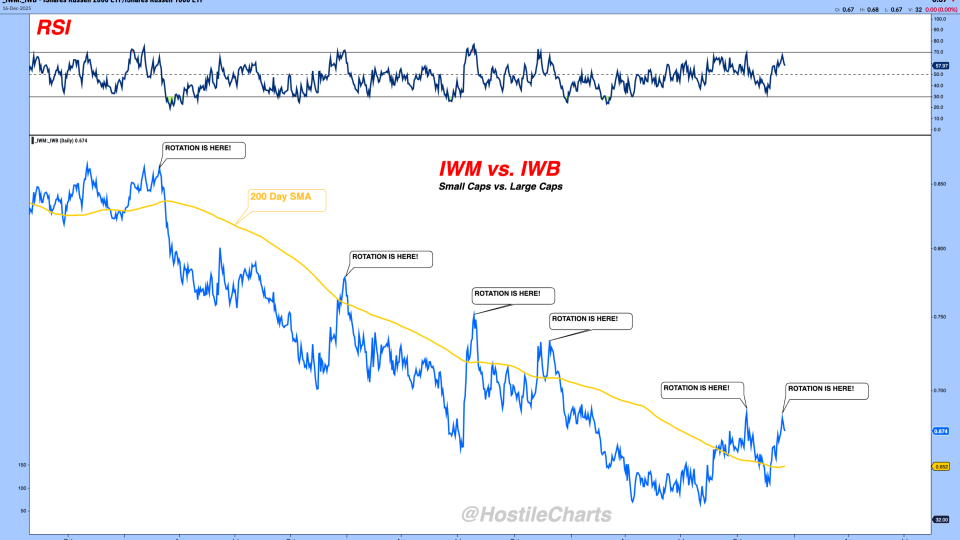
Larry Thompson Rotation is Here Just Kidding..... Everyone loves a good underdog story. I get it. But the obsession with small caps “finally taking over” every time they outperform for a few days still blows my mind. Two or three times a year, small caps catch a bid. Large caps... December 16, 2025
JC Parets Swing Trader Pro: Afternoon Briefing (02-23-2023) From the Desk of Kimmy Sokoloff This morning the market popped. Then it faded most of the day until about 1:00 p.m. ET, when the rally started, right off of... February 23, 2023 Stocks Swing Trader Pro Newsletter
JC Parets [PLUS] Weekly Town Hall w/ Willie Delwiche This is the video recording of the February 23rd, 2023, Weekly Town Hall w/ Willie Delwiche. 2/23/23 2:00 PM ET February 23, 2023 willie plus town hall meeting
Sean McLaughlin [Options P2P] Trade Alert: Exited XLI at Profit Target We had a resting GTC order filled at our profit target in the Paid-to-Play portfolio today: February 23, 2023 Options Paid to Play Paid To Play Members Only
Sean McLaughlin [Options P2P] Trade Alert: Exited XLK Position We had a resting GTC order filled in the Paid-to-Play portfolio today: February 23, 2023 Options Paid to Play Paid To Play Members Only
Patrick Dunuwila Chart of the Day - Thursday, February 23rd, 2023 February 23, 2023 The Chart Report TCR Chart of the Day $DXY US Dollar Greg Rieben
Sean McLaughlin [Options P2P] Adjustment to XRT Position We've adjusted a position in the Paid-to-Play portfolio today: February 23, 2023 Options Paid to Play Paid To Play Members Only
Ian Culley [Video] What the FICC?: Monitoring the Dollar Bounce It's the weekly currency edition of What the FICC? It’s victory at sea across currency markets. But it's not stopping the US dollar from cutting through the chop... Check it out! February 23, 2023 Currencies youtube ASC Ian Currency Report Video
Louis Sykes Relative Strength: The Most Underrated Indicator The most underrated element of technical analysis has to be relative strength. It's impossible to outperform your benchmark if you own assets that are underperforming. Much of this work is grounded in the overarching notion that asset... February 23, 2023 ASC Crypto
JC Parets CFO Erceg Reports an NWL Purchase The most significant insider transaction on today's Hot List is a Form 4 filing by Mark J. Erceg, the CFO of Newell Brands Inc $NWL. Erceg reported a purchase of $999,833 in NWL. February 23, 2023 Stocks Strazza The Hot List
JC Parets Swing Trader Pro: Morning Briefing (02-23-2023) From the Desk of Kimmy Sokoloff As I write this note, the only reason the market is up is because of $NVDA’s earnings. We have GDP today, and that might change the tune. Hopefully, we continue to hold... February 23, 2023 Stocks Swing Trader Pro Newsletter
Steve Strazza The Short Report (02-22-2023) From the Desk of Steve Strazza @Sstrazza When investing in the stock market, we always want to approach it as "a market of stocks." Regardless of the environment, there are always stocks showing leadership and trending higher... February 22, 2023 All Star Charts Premium Premium Stocks ASC Strazza Grant Short Report Members Only
Patrick Dunuwila Daily Chart Report ? Wednesday, February 22nd, 2023 February 22, 2023 The Chart Report Daily Chart Report Front Top Content Featured Stories
JC Parets [PLUS] Weekly Sentiment Report: A Dose of Buyer’s Remorse? From the Desk of Willie Delwiche The NAAIM exposure index surpassed its August high last month and has been on... February 22, 2023 willie plus sentiment Sentiment Report
JC Parets Swing Trader Pro: Afternoon Briefing (02-22-2023) From the Desk of Kimmy Sokoloff $SPY struggled all day to stay above the 400 level. Now we have support at 396.76. If we break that, we can... February 22, 2023 Stocks Swing Trader Pro Newsletter
Ian Culley Breaking the Dollar Down with One Chart From the Desk of Ian Culley @IanCulley Challenging conditions prevail across currency markets. It’s victory at sea! But that’s not stopping the ... February 22, 2023 All Star Charts Premium Currencies ASC Ian Currency Report Members Only
Patrick Dunuwila Chart of the Day - Wednesday, February 22nd, 2023 February 22, 2023 The Chart Report $SPX S&P 500 TCR Chart of the Day $SPY Andy Moss
Sean McLaughlin [Options] Building Premium Homes Slippery markets make for rising options premiums. And one sector ETF is currently rising head and shoulders above the rest, offering some juicy premiums for us to sell into along with a wide risk management band for us to dance in. So let's... February 22, 2023 All Options Options Premium ASC
Louis Sykes Respecting the Risks Equities had their worst session of the year yesterday, as the S&P 500 retraced 2% during the day. This comes as rates and the US dollar push higher, with the yield on the 10-year US Treasury note making fresh three-month highs. ... February 22, 2023 All Star Charts Crypto Crypto Crypto Blog Members Only
Sean McLaughlin [Options P2P] Adjustment to GDXJ Position We've adjusted a position in the Paid-to-Play portfolio today: February 22, 2023 Options Paid to Play Paid To Play Members Only
JC Parets Swing Trader Pro: Morning Briefing (02-22-2023) From the Desk of Kimmy Sokoloff We've got FOMC minutes coming today, so let's be on our toes. We still run the risk that the $SPX can head down to 3,950. February 22, 2023 Stocks Swing Trader Pro Newsletter
JC Parets Abdiel Capital Is Buying More APPN The largest insider transaction on today’s list is a Form 4 filing by Abdiel Capital Advisors. Abdiel revealed a purchase of $4.5 million in Appian Corporation $APPN. February 22, 2023 Stocks Strazza The Hot List
JC Parets [Premium] Mid-Month Conference Call Video Recording February 2023 This is the video recording of the February 2023 Mid-month Conference Call. February 22, 2023 All Star Charts Premium Stocks Conference Call ASC Video Members Only
Ian Culley [Video] Gold Rush: The Search for Relative Strength The stage is set for an epic rally. The catalysts are in place. Yet messy conditions persist as we await ignition and blast off. Regardless, we can use the current environment to find the most buoyant and promising names. Check it... February 21, 2023 All Star Charts Premium All Star Charts Gold Rush Premium ASC Gold Ian Gold Rush Video Members Only
Ian Culley Gold Mining Stocks and the Beachball Effect From the Desk of Ian Culley @IanCulley With the dollar beginning to rise, gold and silver are coming under some selling pressure. Nevertheless, these shiny rocks and their related mining stocks are hanging tough. Instead... February 21, 2023 All Star Charts Premium All Star Charts Gold Rush Premium Commodities ASC Gold Ian Gold Rush Members Only
Chart Request Live You Request It, We Break It Down. December 15, 2025 With special guest(s) Sam Gatlin Alfonso De Pablos, CMT


