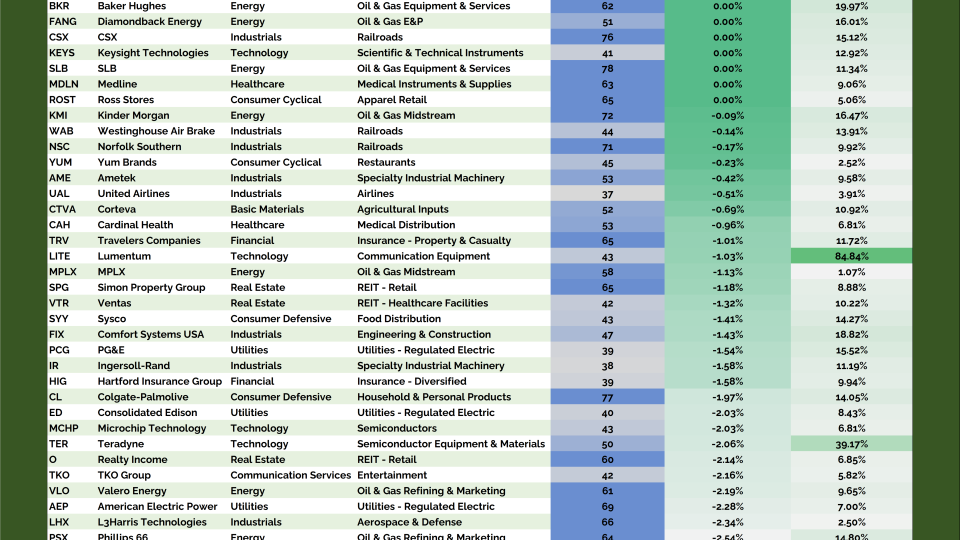
Displaying 6769 - 6792 of 17422

[PLUS] Weekly Top 10 Report

February 6, 2023

From the desk of Steve Strazza @Sstrazza

Our Top 10 Charts Report was just published.

In this weekly note, we highlight 10 of the most important charts or themes we’re currently seeing in asset classes around the world.

Reclaiming a Valuable Line

From an information standpoint, the Value Line Geometric Index (VLG) is one of the best tools we have at our disposal as it represents the median stock’s performance. Seeing this index make a higher high as it reclaims its prior-cycle highs from 2018 and peak from last August is a major bullish development.

[PLUS] Weekly Momentum Report & Takeaways

February 6, 2023

From the desk of Steve Strazza @Sstrazza

Check out this week's Momentum Report, our weekly summation of all the major indexes at a Macro, International, Sector, and Industry Group level.

By analyzing the short-term data in these reports, we get a more tactical view of the current state of markets. This information then helps us put near-term developments into the big picture context and provides insights regarding the structural trends at play.

Let's jump right into it with some of the major takeaways from this week's report:

* ASC Plus Members can access the Momentum Report by clicking the link at the bottom of this post.

Macro Universe:

  • This week, our macro universe was negative, with 57% of our list closing lower with a median return of -0.16%.
  • The Dow Jones Transports $DJT was the winner with a 7.15% gain.
  • The biggest loser was Oil $CL, with a weekly loss of -7.89%.
  • There was a 4% gain in the percentage of assets on our list within 5% of their 52-week highs – currently at 17%.
  • 36% of our macro list made fresh 4-week highs, and 36% made new 13-...
All Star Charts Premium,
All Star Charts Gold Rush

Gold Hits Supply: Precious Metals Levels to Know

February 6, 2023

From the Desk of Ian Culley @IanCulley

The dollar is back and on the move.

After falling for four straight months, the US dollar index $DXY is up three days in a row. Whether the near-term dollar strength turns into a more sustained trend is anyone’s guess.

Regardless, risk assets feel the pressure as many areas begin to correct, including precious metals. 

Despite this recent selling pressure, we have clear levels to trade against when it comes to Silver and mining stocks.

Weekly Market Notes: Bull Market Behavior

February 6, 2023
From the desk of Willie Delwiche.

The number of stocks making new lows remains negligible. Last week, the number of stocks making new 52-week highs on the NYSE + NASDAQ surpassed a number of prior peaks (Dec 2021, Apr 2022, Nov 2022). It’s now at its highest level since November 2021.

More Context: Everyone has their own definition of a bull market. For me, it’s when more stocks are making new highs than new lows. Bear markets tend to end when new lows drop below new highs. Bull markets are sustained when new high lists expand. We are seeing that now among individual stocks and we are seeing that at the industry group level (especially outside of large-caps). In moving from 2022 to 2023 we have transitioned from broad weakness to broad strength. Big day-to-day price swings haven’t gone away, but after volatile years (like we experienced last year) that can be slow to ebb. Most of the strength that looks sustainable is happening beneath the surface of the popular benchmarks or beyond the borders of our country. It’s a new year with new...

All Star Options

[Options Premium] Semis Are Leading Abroad As Well

February 6, 2023

We're already long some domestic semiconductor stocks via options (the trend is working). However, perhaps we've set our sights too close to home.

International stocks have been on a tear recently, showing even greater strength than the U.S. So maybe we should be looking for the strongest stocks, in the strongest sectors, in the strongest countries?

With this in mind, today's trade takes us to Switzerland.

All Star Charts Gold Rush

Gold Hits Supply: Precious Metals Levels to Know

February 6, 2023

From the Desk of Ian Culley @IanCulley

The dollar is back and on the move.

After falling for four straight months, the US dollar index $DXY is up three days in a row. Whether the near-term dollar strength turns into a more sustained trend is anyone’s guess.

Regardless, risk assets feel the pressure as many areas begin to correct, including precious metals. 

Despite this recent selling pressure, we have clear levels to trade against when it comes to Silver and mining stocks.

Before we dive into those critical levels of interest, a friendly reminder…

An overwhelming amount of supply still exists for Gold futures in the 1,924-1,965 zone:


It’s not surprising to witness gold correct below this level, especially since it gained more than 20% off its Nov. low.

In fact, I would be more surprised if gold didn’t pause at this level. I’m not concerned with the selling pressure in Gold.

On the other hand, the next two charts highlight key levels precious metal bulls need to defend.

First up, Silver futures:


I noted a couple weeks ago the bull flag in Silver looked a bit long in the tooth. Fast...

All Star Charts Crypto

Waiting for the Perfect Setup

February 6, 2023

Over the last week, we've seen some mild profit-taking, with Bitcoin and Ethereum chopping around following retests of critical resistance levels.

Our thesis remains that a structural shift has occurred, with the short- and intermediate-term trends now higher.


Swing Trader Pro: Morning Briefing (02-06-2023)

February 6, 2023

From the Desk of Kimmy Sokoloff

I mentioned in Friday's Morning Briefing that if $SPY really breaks below 412.88, we can see 408.

SPY traded in that range this morning. Currently, 408 is support.

If we bounce, we can head back up to 411. If not, we can see 405.13.

February is Like A Bad Hangover

February 6, 2023

Stock market bulls have been rewarded over the past 3 months.

And remember, historically these are the best 3 months of the year - November through January.

And then comes the hangover.

Think about those last three months.

Did you see people having a good time?

Were some having a little too much fun?

Would you agree there was some disorderly conduct?

Were participants behaving as if they were under the influence?

You bet.

And this sort of behavior is normal for this time of the year, and the entire 4-year cycle for that matter.

But then comes February - one of the worst months of the year.

The U.S. Is The Worst

February 5, 2023

"I only trade U.S. Stocks, JC"

"If you can't find a stock in America to buy you're not looking hard enough, JC"

"I live in America, JC"

"I don't know anything about those stocks in other countries, JC"

Trust me, I hear all these things.

Not so much from you guys, as it is my friends and colleagues in the business.

I feel like readers of Allstarcharts know better, and also we have a very global audience.

So the recency bias that oozes out of most American investors, who have gotten accustomed to the U.S. being the best place to be, forgot what it's like when that's not the case.

You're talking...

The Median Stock Breaks Out

February 5, 2023

The Value Line Geometric is one of the more underappreciated indexes that we have at our disposal.

The Dow is the OG, the S&P500 is the benchmark and the Nasdaq gets all the girls.

But you know, it's the Value Line Geometric Index that might actually give us the best information.

Most new 52-wk highs in over a year

February 4, 2023

I remember last year getting yelled at and trolled online because I was talking about breadth improvement.

Just because their stupid computers weren't telling them that it was time to buy didn't stop me and my team from simply counting how many stocks were going up vs how many were going down.

Boy did that serve us well as stocks have absolutely ripped higher over the past couple quarters.

We've been in a raging bull market while most investors keep asking me when stocks are going to bottom.

That's how far removed most people are from reality.

In fact, market breadth has improved so much that we're now seeing more stocks making new 52-week highs than we saw at the peak in the S&P500, Dow Jones Industrial Average and Nasdaq back in late 2021.

Yes, more stocks are making new highs today than there were at the "market's highs":

All Star Charts Premium

International Hall of Famers (02-03-2023)

February 3, 2023

From the desk of Steve Strazza @Sstrazza and Alfonso Depablos @AlfCharts

Our International Hall of Famers list is composed of the 100 largest US-listed international stocks, or ADRs.

We’ve also sprinkled in some of the largest ADRs from countries that did not make the market cap cut. 

These stocks range from some well-known mega-cap multinationals such as Toyota Motor and Royal Dutch Shell to some large-cap global disruptors such as Sea Ltd and Shopify.

It’s got all the big names and more--but only those that are based outside the US. You can find all the largest US stocks on our original Hall of Famers list.

The beauty of these scans is really in their simplicity.

We take the largest names each week and then apply technical filters in a way that the strongest stocks with the most momentum rise to the top.

Based on the market environment, we can also flip the scan on its head and filter for weakness.

Let’s dive in and take a look at some of the most important stocks from around the world.

Here’s this week’s list:

...

All Star Charts Premium

Cotton Prepares to Cut and Run

February 3, 2023

From the Desk of Ian Culley @IanCulley

Forget about what Powell said or whatever you heard on the street. 

We’re still looking for risk assets to buy.

That includes stocks and commodities. Despite the dollar applying downside pressure to risk assets this morning, I want to share one commodity that looks ready to rip…

Check out the weekly chart of Cotton futures:

Cotton experienced a sharp decline last year following an impressive run-up off the 2020 lows. Fast forward to today, and it’s challenging a critical retracement level from below at approximately 89.

The bulls have hammered this level since October of last year. And the way I learned it… 

The more times a level is tested, the higher the likelihood it breaks.

I want to catch a breakout in cotton above 88.30 in the March contract with an upside objective of 114.50 (Note: cotton is set to roll to the May contract based on volume next...