
A funny thing happened to semiconductor ETFs in July.
Todd Sohn joined us on The Morning Show today, and he shared a great scatter plot. Twenty-day flows into semiconductor ETFs on one axis, twenty-day price change on the other, with July highlighted in red.
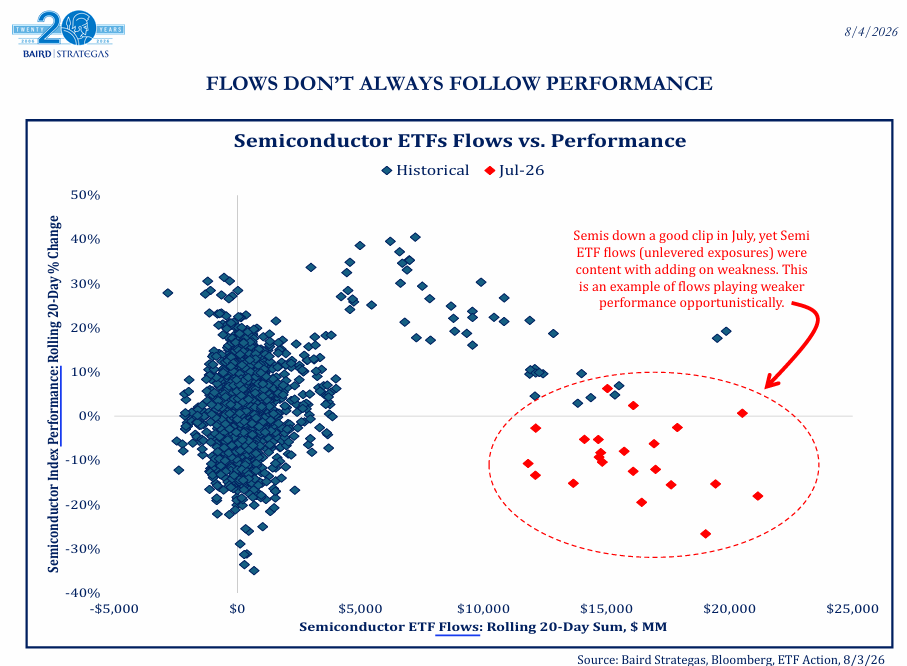
Normally those move together. Stocks go up, money comes in. Stocks go down, money leaves.
July didn't do that. Semis got hit hard, tagging the 200-day moving average, and yet people kept buying the whole way down.
There are a few ways to interpret this information.
You could just throw it out and say “See? Flows data is meaningless.”
You could also take that as conviction, as JC did. He mentioned that he kept getting asked at a conference yesterday whether the party was over for semiconductor stocks.
As if one bad month following a 70% run in three months is abnormal.
Todd’s take is simply that everyone everywhere is tied to this trade. So it’ll probably take more than an 18% drawdown to get people to give up.
In other words, if an 18% drawdown doesn't get anybody to leave, then July resolved nothing. Everyone who was going to sell didn't. They're all still in the boat.
When something has worked as well as semis has for the last three years, people don't read a pullback as a sell signal. They read it as a discount.
That's why I like having Todd on. He doesn't tell you what to do. He tells you what everyone else already did.
– Spencer
P.S. Todd said energy is anti-beta right now, and JC said the other 40% of a portfolio probably belongs in commodities anyway. Neither of them went further than that.
Jason Perz will. He's hosting a free briefing Thursday, August 6th at 2pm ET on what he calls the T.A.P.E. Trade. Trump Always Pays Energy.
This invitation appeared in the August 4, 2026 issue and refers to the August 6, 2026 event.
His argument is that everyone watching Iran and Hormuz and Big Oil's profits is watching the wrong number. Crude is up about 50% this year. The fuels refined from it are up closer to 100%. The margin in between just hit an all-time high, and it's landing inside a handful of American companies nobody talks about.
Save your seat — free, no spam, unsubscribe anytime.
Questions and answers
#From the August 4, 2026 Daily Rundown.
What was unusual about the semiconductor ETF flows Todd Sohn showed?
Money continued entering the funds during July's price decline, rather than leaving alongside falling stocks. His chart compared flows with price change over the same period. The contrast revealed buying into weakness, but did not by itself establish that the pullback was finished.
Why could continued inflows be read as both conviction and unresolved crowding?
JC saw willingness to buy the dip as conviction after a strong prior advance. Spencer also noted that investors had not been forced out, leaving much of the same exposure in place. Flow data described what holders did; it did not dictate which interpretation would prove right next.
Originally published by Spencer Israel.