Only 51% of Nasdaq 100 stocks are trading above their 200-day moving average.
Here’s the chart:
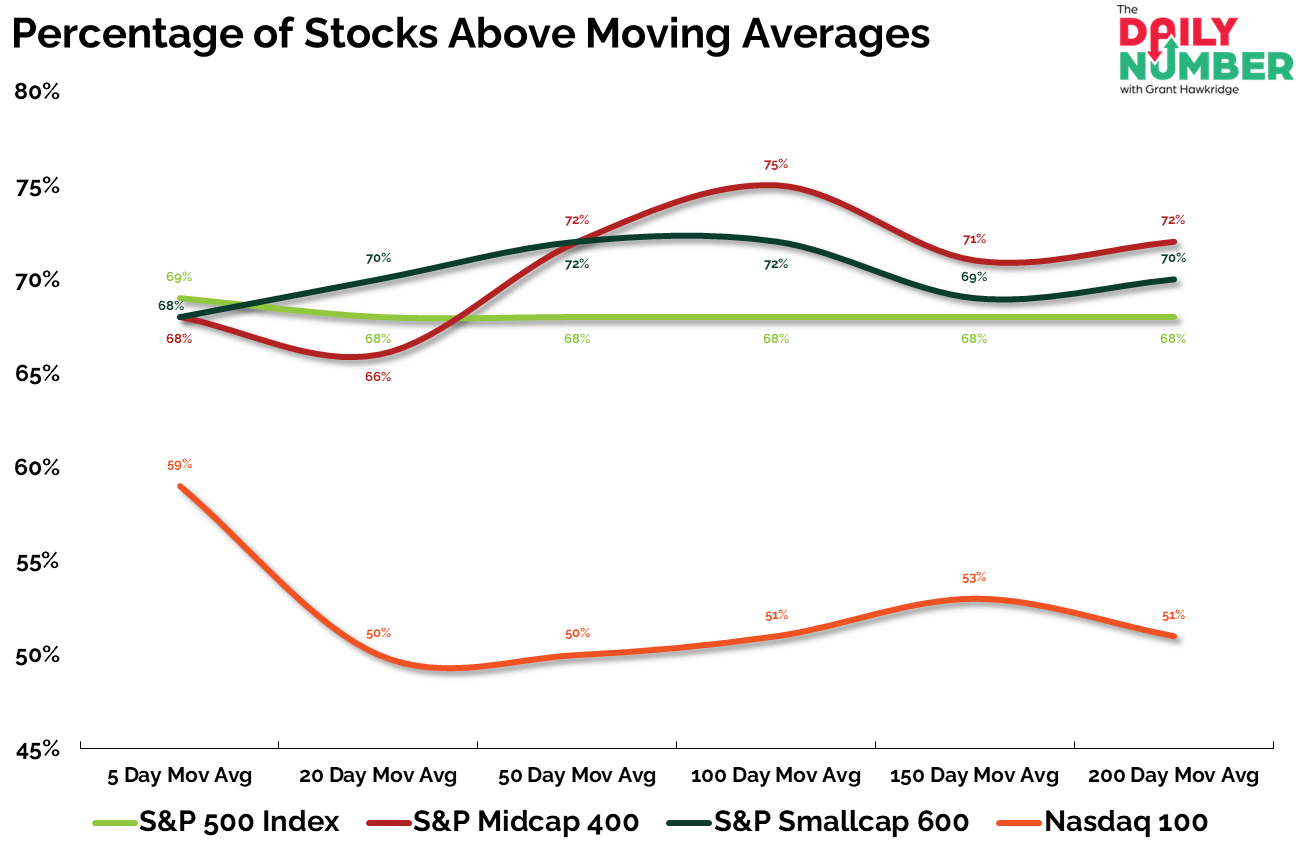
Let's break down what the chart shows:
The chart displays four lines representing the percentage of stocks trading above different moving averages.
The light green line represents the S&P 500.
The red line represents the S&P Mid-Cap 400.
The dark green line represents the S&P Small-Cap 600.
The orange line represents the Nasdaq 100.
The Takeaway: Broad participation is here.
About 68% of S&P 500 stocks sit above every moving average from the 5-day through the 200-day. That’s two-thirds of the market that is still above key trends.
Mid-caps say the same thing, just better. Roughly 72% of S&P 400 stocks remain above the 200-day moving average. Small-caps repeat the same story, with around 70% of S&P 600 stocks staying above their key moving averages.
Risk appetite is present.
That is what makes the Nasdaq 100 stand out. Only 51% of its stocks are above the 200-day moving average. That gap is large and isolated to one part of the market.
This is not broad weakness.
Large-caps outside mega-cap growth are fine.
Mid-caps are fine.
Small-caps are fine.
The weakness sits inside a narrow group of crowded Nasdaq names.
When most of the market holds above key trends and the Nasdaq 100 does not, the weakness just sits in last year’s leaders, not the market.
The market underneath is still working. Leadership is shifting away from mega-cap growth.
So, are you trading the index, or the stocks that are actually moving?
If you find my content valuable, I would greatly appreciate it if you could share it with your friends, family, and colleagues. Your help in spreading the word is invaluable in supporting our work. Thank you to all of you who share!