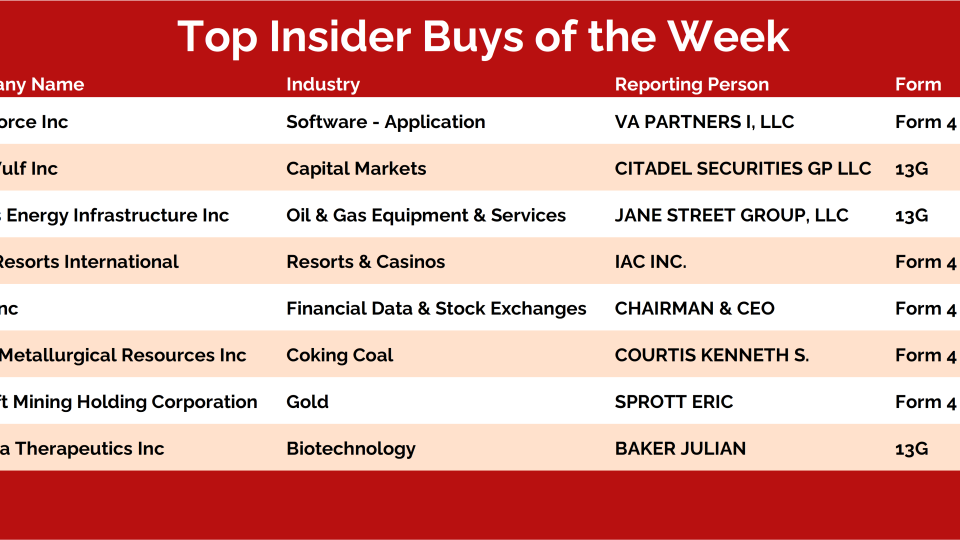
Displaying 8593 - 8616 of 17419

[PLUS] Weekly Top 10 Report

July 25, 2022

From the desk of Steve Strazza @Sstrazza

Our Top 10 Charts Report was just published.

In this weekly note, we highlight 10 of the most important charts or themes we're currently seeing in asset classes around the world.

Materials Hook Higher

Procyclical areas of the stock market are bouncing back after the recent bout of selling pressure. The Equal-Weight Materials ETF RTM is a prime example as it reclaims a critical level of former support. Now that these raw material and commodity-related stocks are back within their prior ranges, we're watching commodities closely to see if they follow suit. As long as RTM is holding above its shelf of former lows from last year, our equal-weight commodity index is most likely finding support at its respective level. On the flip side, the search for a floor in commodities is likely to continue if the recent rebound in materials is only a dead cat bounce. Ultimately, these two charts should resolve in the same direction.

[PLUS] Weekly Market Notes

July 25, 2022
From the desk of Willie Delwiche.

Key Takeaway:

  • Fed in spotlight as Powell & Co move rates to last cycle’s peak.
  • A dovish pivot when financial stress has never been lower seems unlikely.
  • Persistent bear market leaves bulls needing to prove their case.

While high relative to the previous decade, the Fed could in 2019 at least make the argument that inflation and wage growth were low from a historical perspective. Additionally there was evidence that financial stresses were starting to build. Now, the wage and price pressures that were still incubating in 2019 have erupted to their highest levels in decades while at the same time the financial stress has never been lower (according to the St. Louis Fed’s index).

The market has currently priced in another 100 basis points of tightening over the final three FOMC meetings this year (September, November, December). There is some expectation that Powell will use his post-FOMC press...

[PLUS] Weekly Momentum Report & Takeaways

July 25, 2022

From the desk of Steve Strazza @Sstrazza

Check out this week's Momentum Report, our weekly summation of all the major indexes at a Macro, International, Sector, and Industry Group level.

By analyzing the short-term data in these reports, we get a more tactical view of the current state of markets. This information then helps us put near-term developments into the big picture context and provides insights regarding the structural trends at play.

Let's jump right into it with some of the major takeaways from this week's report:

* ASC Plus Members can access the Momentum Report by clicking the link at the bottom of this post.

Macro Universe:

  • This week, our macro universe was positive as 83% of our list closed higher with a median return of 1.79%.
  • High Beta $SPHB was the winner, closing with a 6.14% gain.
  • The biggest loser was the Lumber $LB, with a weekly loss of -14.18 %.
  • There was a 2% gain in the percentage of assets on our list within 5% of their 52-week highs – currently at 4%.
  • 45% of our macro list made fresh 4-week highs.
  • Meanwhile,...
All Star Options

[Options Premium] Creating Our Own Income Stream From Gold

July 25, 2022

Ok, maybe that title is a little dramatic. I couldn't help myself. I recently had a conversation with a trader friend who was dunking on Gold Bugs about the lack of income stream from Gold. It's just a damn rock! he said.

Anyway, I don't have any strong opinions about Gold either way. I just like to follow price and volatility. And right now, the options market may be offering us a tempting opportunity to collect some premium as the recent gold selloff has spooked the gold bulls a little bit.

All Star Charts Crypto

A Low-Conviction Tape

July 25, 2022

From the desk of Louis Sykes @haumicharts

Last week, we advocated again for a patient approach.

We remain cautious about buying too heavily into short-term breakouts. This is a tape where whipsaws and fake-outs can be anticipated.

Many names find themselves firmly below overhead supply, and we expect any short-term strength to be aggressively sold into.

In the depths of this most recent drawdown, market participants were approaching their maximum pain thresholds. It makes sense that the market finds supply from holders looking to break even on their losses.

There are two ways to approach this tape from a trading perspective:


Insider Data Shifts From Bullish to Bearish

July 25, 2022

We’ve seen very little insider activity the past few weeks and today is no different, as we have just a single Form 4 on our Hot List.

This lack of interest is reflected in the ratio of insider sells to insider buys, which just hit its highest level since early 2021.

Chart of the Day: This is it!

July 25, 2022

This to me is the big one.

The chart below is the one I'm watching the closest.

You guys have been hearing me pound the table about the US Dollar and what a hard time stocks and crypto will (continue to) have in a stronger Dollar environment.

So here you have it. This is the Emerging Markets ETF $CEW back to the same level where it bottomed out the only 2 other times it was ever down here:

Silver ETF Hits New All-time Lows relative to the S&P500

July 23, 2022

I remember 2010-2011 like it was yesterday.

Precious metals were all the rage.

Silver miners were the meme stocks of their day.

There was so much money being made in Silver.

And then all that changed.

No one has heard from those silver surfers ever again.

And now here we are watching the Silver ETF $SLV close the week at its lowest price in history relative to the S&P500:

[PLUS] Weekly Observations & One Chart for the Weekend

July 22, 2022

From the desk of Willie Delwiche.

Stocks have rallied off of their mid-June lows, but it goes without saying that 2022 has still been a year marked by volatility and an absence of strength. In fact it has been historic (or nearly so) on both accounts. In terms of volatility, only two years (2008 and 2002) finished with a higher percentage of days on which the S&P 500 closed up or down by 1% or more than we have seen so far in 2022 (just shy of 50%). No year has come close to as low a percentage of days with more new highs than new lows. So far we have had seven in 2022: two in January, three in March and one each in April and May. That is just 5% of the trading days so far this year. The next closest year was 2008, which had new highs > new lows on just 13% of the days. At the opposite extreme is 2017, regarded by many as one of the best years in stock market history. That year, 90% of the days saw more stocks making new highs than new lows, only 3% of the days had the S&P 500 moving by more than 1%, and the S&P 500 booked a nearly 20% gain.

...

All Star Charts Premium

Will Commodities Find a Floor?

July 22, 2022

From the desk of Ian Culley @IanCulley

Commodities have been on the ropes for more than a month. As for commodity stocks, they’ve been under pressure since the start of Q2.

But the steep decline in these inflationary assets is beginning to slow – and it couldn’t happen at a more logical place.

The CRB Index and numerous bellwether commodity stocks are digging in and finding support at key levels. Whether these levels hold is anyone’s guess.

But the first step of the base building process is to stop going down. 

Let’s take a look.

First up is the CRB Index:

After a meteoric rise off the pandemic lows, commodities are experiencing their first significant correction in two years.

It’s not surprising the index stopped going up at a shelf of former highs from 2012 and 2014. There’s obviously a significant amount of resistance at those levels.

Now, the question is whether demand will come in at this critical shelf of...

All Star Charts Premium

International Hall of Famers (07-22-2022)

July 22, 2022

From the desk of Steve Strazza @Sstrazza

Our International Hall of Famers list is composed of the 100 largest US-listed international stocks, or ADRs. We’ve also sprinkled in some of the largest ADRs from countries that did not make the market-cap cut. 

These stocks range from some well-known mega-cap multinationals such as Toyota Motor and Royal Dutch Shell to some large-cap global disruptors such as Sea Ltd and Shopify.

It’s got all the big names and more--but only those that are based outside the US. You can find all the largest US stocks on our original Hall of Famers list.

The beauty of these scans is really in their simplicity.

We take the largest names each week and then apply technical filters in a way that the strongest stocks with the most momentum rise to the top.

Based on the market environment, we can also flip the scan on its head and filter for weakness.

Let’s dive in and take a look at some of the most important stocks from around the world.

Here’s this week’s list:

...

Hot Corner Insider

The Inside Scoop (07-22-2022)

July 22, 2022

From the desk of Steve Strazza @Sstrazza

It’s been a while since we had two long ideas from The Hot List in a single week. 

But with markets in rally mode for the past month, we’ve had some strong stocks pop up on our scan.

While new highs are hard to trust in this tape, any names setting up for breakouts are stocks we want on our radar.

If they're unable to make a decisive upside resolution now, they'll probably be some of the first stocks to do so when the selling pressure finally eases.

We talked about one name we can put in this category earlier in the week, which you can read here. Today, we have another one.

Commodity Check: Jeera July 2022

July 22, 2022

Base Metals have been correcting off late and tearing through their support zones. Agricultural commodities on the other hand have displayed resilience during this market correction. While prices have moved lower, the inherent strength is still visible.

Today we're here to discuss a commodity that is trading at new multi-year highs: Jeera.