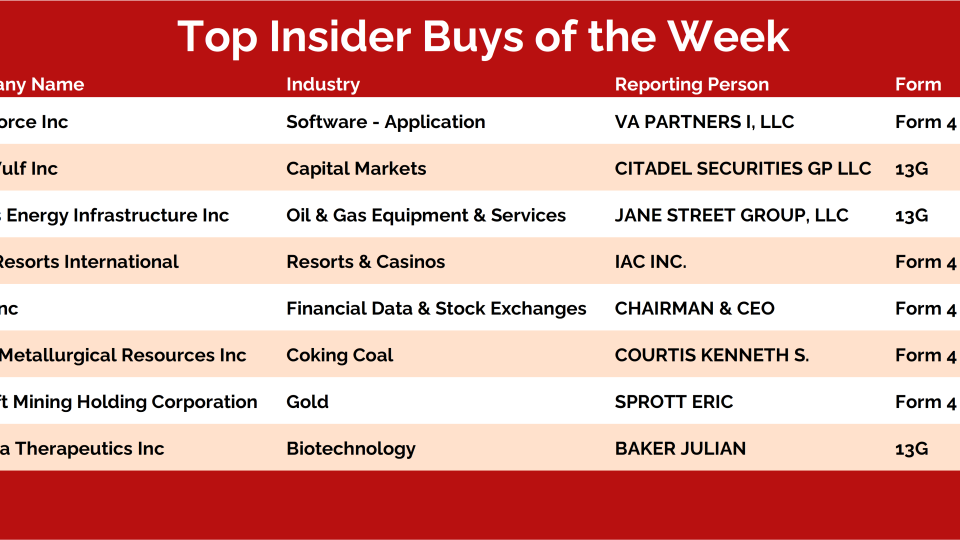
Steve Strazza Bitcoin, Baker Bros & Casinos Every weekend, I dig into our insider activity tracker looking for the biggest conviction buys — and this week checked all the boxes: Baker Bros, coal stocks, big software bets, and precious metals. Let’s take a look:... December 14, 2025 Hot Corner Insider Search Displaying 8617 - 8640 of 20064 Sean McLaughlin [Options P2P] New Position: DIA The next new position in our Paid-to-Play portfolio is: May 11, 2023 Options Paid to Play Paid To Play Members Only JC Parets Risk Reversal In Small-caps Small-cap stocks are back down to where they bottomed out last summer. Can they do it again? I believe they can, and that's the... May 11, 2023 Stocks ASC ASC Chart of the Day JC Parets Hestia Capital Raises Its PBI Stake to 9% The largest insider transaction on today’s Hot List is a Form 4 filing by Pulse Biosciences $PLSE director Robert W. Duggan. Duggan reported a purchase worth roughly $65 million in PLSE. May 11, 2023 Stocks Strazza The Hot List JC Parets Swing Trader Pro: Morning Briefing (05-11-2023) From the Desk of Kimmy Sokoloff It's just like Tuesday... With PPI coming up at 8:30 a.m. ET, I'm going to hold off on sharing ideas until I see how the market reacts. May 11, 2023 Stocks Swing Trader Pro Newsletter Alfonso De Pablos, CMT 2 to 100 Club (05-10-2023) From the Desk of Steve Strazza @Sstrazza Welcome to the 2 to 100 Club. As many of you know, something we've been working on internally is using various bottom-up tools and... May 10, 2023 All Star Charts Premium 2 to 100 Club Premium Stocks ASC Strazza 2-to-100 Club Members Only Patrick Dunuwila Daily Chart Report 📈 Wednesday, May 10, 2023 May 10, 2023 The Chart Report Uncategorized Daily Chart Report Front Top Content Featured Stories JC Parets Swing Trader Pro: Afternoon Briefing (05-10-2023) From the Desk of Kimmy Sokoloff What a day... $SPY came close to the 415 level I mentioned this morning and then traded below 410. ... May 10, 2023 Stocks Swing Trader Pro Newsletter Patrick Dunuwila Chart of the Day - Wednesday, May 10, 2023 May 10, 2023 The Chart Report Uncategorized Momentum $SPX Todd Sohn TCR Chart of the Day Sean McLaughlin [Options] It's Now or Never, Smalls [9/7: updated stop to 180. We're already #FreeRiding, so whatever we sell for is pure profit!] It's time for the small caps to make a stand. The time is now. If they don't, it could be 'goodnight' for a long time. ... May 10, 2023 All Options Options Premium ASC Sean McLaughlin [Options P2P] New Position: XLV The next new position in our Paid-to-Play portfolio is: May 10, 2023 Options Paid to Play Paid To Play Members Only Sean McLaughlin [Options P2P] Trade Alert: Exited XLP For a Profit We had a resting GTC order filled at our profit target in the Paid-to-Play portfolio today: May 10, 2023 Options Paid to Play Paid To Play Members Only JC Parets Insiders Scoop Up EVA, USB, and SOFI Shares The largest insider transaction on today’s Hot List is a Form 4 filing by Enviva Inc $EVA director John Bumgarner Jr. Bumgarner reported a purchase worth roughly $1.8 million in EVA. May 10, 2023 Stocks Strazza The Hot List JC Parets Swing Trader Pro: Morning Briefing (05-10-2023) From the Desk of Kimmy Sokoloff CPI data for April will be released at 8:30 a.m. ET. I'll hold off on ideas until I see how the market reacts. May 10, 2023 Stocks Swing Trader Pro Newsletter JC Parets Inside Scoop Weekly Strategy Session - May 10, 2023 This is the video recording of the May 10, 2023, Inside Scoop Weekly Strategy Session. May 10, 2023 Hot Corner Insider Stocks Strazza Inside Scoop Inside Scoop Strategy Session Inside Scoop Strategy Session Members Only Patrick Dunuwila Daily Chart Report 📈 Tuesday, May 9, 2023 May 9, 2023 The Chart Report Uncategorized Daily Chart Report Front Top Content Featured Stories Sean McLaughlin I Make Quick Decisions I make quick decisions. Is that because I’m a trader? Or am I a trader because I make quick decisions?... May 9, 2023 All Options ASC JC Parets Swing Trader Pro: Afternoon Briefing (05-09-2023) From the Desk of Kimmy Sokoloff The market was in a standstill today, awaiting the CPI print on Wednesday. The indices held on. Tomorrow might give a... May 9, 2023 Stocks Swing Trader Pro Newsletter Ian Culley DXY and Gold: Smart Money Bets on a Weaker Dollar From the Desk of Ian Culley @IanCulley Dollar bulls hold the line. The US Dollar Index $DXY is clinging to the 100 level, refusing to let go despite new 52-week highs for the British pound and a steady rise in the... May 9, 2023 All Star Charts Premium Currencies ASC Ian Currency Report Members Only Patrick Dunuwila Chart of the Day - Tuesday, May 9, 2023 May 9, 2023 The Chart Report $SPX Stephen Suttmeier Russell 2000 TCR Chart of the Day $IWM JC Parets Re: Buying The Small-caps The weakness in Small-caps has been well documented by now. Look at the performance since the beginning of 2022. While the Dow, S... May 9, 2023 Stocks ASC ASC Chart of the Day Sean McLaughlin [Options P2P] New Position: XOP The next new position in our Paid-to-Play portfolio is: May 9, 2023 Options Paid to Play Paid To Play Members Only JC Parets Ares Management Reports Another FYBR Purchase The largest insider transaction on today’s list comes in a Form 4 filing by Ares Management. The firm revealed a $7.5 million purchase in Frontier Communications Parent $FYBR. May 9, 2023 Stocks Strazza The Hot List JC Parets Swing Trader Pro: Morning Briefing (05-09-2023) From the Desk of Kimmy Sokoloff $QQQ hit a fresh high yesterday, and this morning we're pulling back. We could be in a standstill until tomorrow's CPI data. May 9, 2023 Stocks Swing Trader Pro Newsletter Ian Culley Gold: Focus on Support as Supply Looms Large From the Desk of Ian Culley @IanCulley There’s a mountain of bullish evidence supporting an upside... May 8, 2023 All Star Charts Premium All Star Charts Gold Rush Premium ASC Gold Ian Gold Rush Members Only Pagination Back 1 … Page 356 Page 357 Page 358 Page 359 Page 360 Page 361 Page 362 Page 363 Page 364 … 836 Next Recent Episodes Thompson's Two Cents The Bull Markets Next Step December 12, 2025 Hosted by Larry Thompson The Morning Show It's Crypto Friday on The Morning Show December 12, 2025 Hosted by Spencer Israel JC Parets Steve Strazza With special guest(s) Kenny Glick Louis Sykes Larry Thompson Crypto After Dark The Most Ambitious Crypto Ever? December 11, 2025 Hosted by Louis Sykes Options Jam Session The Options Edge: Powerful Strategies for Today’s Market December 11, 2025 Hosted by Sean McLaughlin ASC Gold Rush Live Gold Rush Live! December 11, 2025 Hosted by Jason Perz Sam Gatlin The Long And Short Of It with Kenny Glick December 11th December 11, 2025 Hosted by Kenny Glick Missed it? No problem!Replays of all our past episodes are always available in the episode archives. View Episode Archives
Steve Strazza Bitcoin, Baker Bros & Casinos Every weekend, I dig into our insider activity tracker looking for the biggest conviction buys — and this week checked all the boxes: Baker Bros, coal stocks, big software bets, and precious metals. Let’s take a look:... December 14, 2025 Hot Corner Insider
Sean McLaughlin [Options P2P] New Position: DIA The next new position in our Paid-to-Play portfolio is: May 11, 2023 Options Paid to Play Paid To Play Members Only
JC Parets Risk Reversal In Small-caps Small-cap stocks are back down to where they bottomed out last summer. Can they do it again? I believe they can, and that's the... May 11, 2023 Stocks ASC ASC Chart of the Day
JC Parets Hestia Capital Raises Its PBI Stake to 9% The largest insider transaction on today’s Hot List is a Form 4 filing by Pulse Biosciences $PLSE director Robert W. Duggan. Duggan reported a purchase worth roughly $65 million in PLSE. May 11, 2023 Stocks Strazza The Hot List
JC Parets Swing Trader Pro: Morning Briefing (05-11-2023) From the Desk of Kimmy Sokoloff It's just like Tuesday... With PPI coming up at 8:30 a.m. ET, I'm going to hold off on sharing ideas until I see how the market reacts. May 11, 2023 Stocks Swing Trader Pro Newsletter
Alfonso De Pablos, CMT 2 to 100 Club (05-10-2023) From the Desk of Steve Strazza @Sstrazza Welcome to the 2 to 100 Club. As many of you know, something we've been working on internally is using various bottom-up tools and... May 10, 2023 All Star Charts Premium 2 to 100 Club Premium Stocks ASC Strazza 2-to-100 Club Members Only
Patrick Dunuwila Daily Chart Report 📈 Wednesday, May 10, 2023 May 10, 2023 The Chart Report Uncategorized Daily Chart Report Front Top Content Featured Stories
JC Parets Swing Trader Pro: Afternoon Briefing (05-10-2023) From the Desk of Kimmy Sokoloff What a day... $SPY came close to the 415 level I mentioned this morning and then traded below 410. ... May 10, 2023 Stocks Swing Trader Pro Newsletter
Patrick Dunuwila Chart of the Day - Wednesday, May 10, 2023 May 10, 2023 The Chart Report Uncategorized Momentum $SPX Todd Sohn TCR Chart of the Day
Sean McLaughlin [Options] It's Now or Never, Smalls [9/7: updated stop to 180. We're already #FreeRiding, so whatever we sell for is pure profit!] It's time for the small caps to make a stand. The time is now. If they don't, it could be 'goodnight' for a long time. ... May 10, 2023 All Options Options Premium ASC
Sean McLaughlin [Options P2P] New Position: XLV The next new position in our Paid-to-Play portfolio is: May 10, 2023 Options Paid to Play Paid To Play Members Only
Sean McLaughlin [Options P2P] Trade Alert: Exited XLP For a Profit We had a resting GTC order filled at our profit target in the Paid-to-Play portfolio today: May 10, 2023 Options Paid to Play Paid To Play Members Only
JC Parets Insiders Scoop Up EVA, USB, and SOFI Shares The largest insider transaction on today’s Hot List is a Form 4 filing by Enviva Inc $EVA director John Bumgarner Jr. Bumgarner reported a purchase worth roughly $1.8 million in EVA. May 10, 2023 Stocks Strazza The Hot List
JC Parets Swing Trader Pro: Morning Briefing (05-10-2023) From the Desk of Kimmy Sokoloff CPI data for April will be released at 8:30 a.m. ET. I'll hold off on ideas until I see how the market reacts. May 10, 2023 Stocks Swing Trader Pro Newsletter
JC Parets Inside Scoop Weekly Strategy Session - May 10, 2023 This is the video recording of the May 10, 2023, Inside Scoop Weekly Strategy Session. May 10, 2023 Hot Corner Insider Stocks Strazza Inside Scoop Inside Scoop Strategy Session Inside Scoop Strategy Session Members Only
Patrick Dunuwila Daily Chart Report 📈 Tuesday, May 9, 2023 May 9, 2023 The Chart Report Uncategorized Daily Chart Report Front Top Content Featured Stories
Sean McLaughlin I Make Quick Decisions I make quick decisions. Is that because I’m a trader? Or am I a trader because I make quick decisions?... May 9, 2023 All Options ASC
JC Parets Swing Trader Pro: Afternoon Briefing (05-09-2023) From the Desk of Kimmy Sokoloff The market was in a standstill today, awaiting the CPI print on Wednesday. The indices held on. Tomorrow might give a... May 9, 2023 Stocks Swing Trader Pro Newsletter
Ian Culley DXY and Gold: Smart Money Bets on a Weaker Dollar From the Desk of Ian Culley @IanCulley Dollar bulls hold the line. The US Dollar Index $DXY is clinging to the 100 level, refusing to let go despite new 52-week highs for the British pound and a steady rise in the... May 9, 2023 All Star Charts Premium Currencies ASC Ian Currency Report Members Only
Patrick Dunuwila Chart of the Day - Tuesday, May 9, 2023 May 9, 2023 The Chart Report $SPX Stephen Suttmeier Russell 2000 TCR Chart of the Day $IWM
JC Parets Re: Buying The Small-caps The weakness in Small-caps has been well documented by now. Look at the performance since the beginning of 2022. While the Dow, S... May 9, 2023 Stocks ASC ASC Chart of the Day
Sean McLaughlin [Options P2P] New Position: XOP The next new position in our Paid-to-Play portfolio is: May 9, 2023 Options Paid to Play Paid To Play Members Only
JC Parets Ares Management Reports Another FYBR Purchase The largest insider transaction on today’s list comes in a Form 4 filing by Ares Management. The firm revealed a $7.5 million purchase in Frontier Communications Parent $FYBR. May 9, 2023 Stocks Strazza The Hot List
JC Parets Swing Trader Pro: Morning Briefing (05-09-2023) From the Desk of Kimmy Sokoloff $QQQ hit a fresh high yesterday, and this morning we're pulling back. We could be in a standstill until tomorrow's CPI data. May 9, 2023 Stocks Swing Trader Pro Newsletter
Ian Culley Gold: Focus on Support as Supply Looms Large From the Desk of Ian Culley @IanCulley There’s a mountain of bullish evidence supporting an upside... May 8, 2023 All Star Charts Premium All Star Charts Gold Rush Premium ASC Gold Ian Gold Rush Members Only
The Morning Show It's Crypto Friday on The Morning Show December 12, 2025 Hosted by Spencer Israel JC Parets Steve Strazza With special guest(s) Kenny Glick Louis Sykes Larry Thompson
Options Jam Session The Options Edge: Powerful Strategies for Today’s Market December 11, 2025 Hosted by Sean McLaughlin