Steve Strazza Bitcoin, Baker Bros & Casinos Every weekend, I dig into our insider activity tracker looking for the biggest conviction buys — and this week checked all the boxes: Baker Bros, coal stocks, big software bets, and precious metals. Let’s take a look:... December 14, 2025 Hot Corner Insider Search Displaying 9409 - 9432 of 20064 Ian Culley Follow The Flow (02-06-2023) From the Desk of Steve Strazza @sstrazza and Alfonso Depablos @Alfcharts This is one of our favorite bottom-up scans: Follow the Flow. In this note, we simply create a universe of stocks that experienced the most unusual... February 6, 2023 All Star Charts Premium Premium Stocks ASC Strazza Follow The Flow Alfonso Members Only Ian Culley Under The Hood (02-06-2023) From the desk of Steve Strazza @Sstrazza. Welcome back to our latest Under The Hood column where we'll cover all the action for the week ended February 3, 2023. This... February 6, 2023 All Star Charts Premium Premium Stocks ASC Strazza Under The Hood Grant Members Only Ian Culley [PLUS] Weekly Top 10 Report From the desk of Steve Strazza @Sstrazza Our Top 10 Charts Report was just published. In this weekly note, we highlight 10 of the most important charts or themes we’re currently seeing in asset classes around the world. ... February 6, 2023 Strazza plus Top 10 Ian Culley [PLUS] Weekly Momentum Report & Takeaways From the desk of Steve Strazza @Sstrazza Check out this week's Momentum Report, our weekly summation of all the major indexes at a Macro, International, Sector, and Industry Group level. By analyzing the short-term... February 6, 2023 Strazza plus momo Ian Culley [Video] Gold Rush: Levels to Watch as Metals Correct It's the weekly Gold Rush! This week Strazza and I highlight critical levels to keep on your radar in the coming days and weeks. Check it out... February 6, 2023 All Star Charts Premium All Star Charts Gold Rush ASC Gold Strazza Ian Gold Rush Video Members Only Ian Culley Gold Hits Supply: Precious Metals Levels to Know From the Desk of Ian Culley @IanCulley The dollar is back and on the move. After falling for four straight months, the US dollar index $DXY is up three days in a row. Whether the near-term dollar strength turns into a more... February 6, 2023 All Star Charts Premium All Star Charts Gold Rush ASC Gold Ian Gold Rush Members Only JC Parets Swing Trader Pro: Afternoon Briefing (02-06-2023) From the Desk of Kimmy Sokoloff The market was down but pretty much range-bound today. It was hard to gain traction on the long side, and I was stopped out... February 6, 2023 Stocks Swing Trader Pro Newsletter JC Parets Weekly Market Notes: Bull Market Behavior From the desk of Willie Delwiche. The number of stocks making new lows remains negligible. Last week, the number of stocks making... February 6, 2023 willie plus Notes Market Notes Patrick Dunuwila Chart of the Day - Monday, February 6th, 2023 February 6, 2023 The Chart Report TCR Chart of the Day $DXY US Dollar Brian Joyce Sean McLaughlin [Options Premium] Semis Are Leading Abroad As Well We're already long some domestic semiconductor stocks via options (the trend is working). However, perhaps we've set our sights too close to home. International stocks have been on a tear recently, showing even greater strength than the U.S.... February 6, 2023 All Star Options Options Options Premium Members Only Ian Culley Gold Hits Supply: Precious Metals Levels to Know From the Desk of Ian Culley @IanCulleyThe dollar is back and on the move.After falling for four straight months, the US dollar index $DXY is up three days in a row. Whether the near-term dollar strength turns into a more... February 6, 2023 ASC Gold Rush Report Louis Sykes Waiting for the Perfect Setup Over the last week, we've seen some mild profit-taking, with Bitcoin and Ethereum chopping around following retests of critical resistance levels. Our thesis remains that a structural shift has occurred, with the short- and intermediate-term... February 6, 2023 All Star Charts Crypto Crypto Crypto Blog Members Only Sean McLaughlin [Options P2P] Adjustment to EEM Position We've adjusted a position in the Paid-to-Play portfolio today: February 6, 2023 Options Paid to Play Paid To Play Members Only JC Parets Ryan Cohen Reveals a Large JWN Stake Both Icahn School of Medicine at Mount Sinai and CMLS Holdings LLC filed Form 4s for a combined amount of $40 million in GeneDx Holdings Corp $WGS. Activist investor and retail industry entrepreneur... February 6, 2023 Stocks Strazza The Hot List JC Parets Swing Trader Pro: Morning Briefing (02-06-2023) From the Desk of Kimmy Sokoloff I mentioned in Friday's Morning Briefing that if $SPY really breaks below 412.88, we can see 408. SPY traded in that range this morning. Currently, 408 is support. If we... February 6, 2023 Stocks Swing Trader Pro Newsletter JC Parets February is Like A Bad Hangover Stock market bulls have been rewarded over the past 3 months. And remember, historically these are the best 3 months of the year - November through January. And then comes the hangover. Think about those last three months.... February 6, 2023 Stocks Currencies ASC ASC Chart of the Day JC Parets The U.S. Is The Worst "I only trade U.S. Stocks, JC" "If you can't find a stock in America to buy you're not... February 5, 2023 Stocks ASC JC Parets The Median Stock Breaks Out The Value Line Geometric is one of the more underappreciated indexes that we have at our disposal. The Dow is the OG, the S&P500 is the benchmark and the Nasdaq gets... February 5, 2023 Stocks ASC ASC Chart of the Day JC Parets Saturday Morning Chartoons: Bull Market Continues This is the weekly post that aggregates all the charts we put together throughout the week and organizes them all into one, easy to flip through deck. ... February 4, 2023 All Star Charts Premium Stocks ASC ASC Chart of the Day Members Only JC Parets Most new 52-wk highs in over a year I remember last year getting yelled at and trolled online because I was talking about breadth improvement. Just because their stupid computers weren't telling them that it... February 4, 2023 Stocks ASC breadth ASC Chart of the Day Ian Culley [Video] What the FICC?: A Friday Triple Play It's the weekly commodity edition of What the FICC? Since I've been under the weather this week, I wanted to share three of my favorite charts from the entire FICC space heading into the weekend. Check it out! February 3, 2023 Commodities youtube ASC Ian Commodities Weekly Video Alfonso De Pablos, CMT International Hall of Famers (02-03-2023) From the desk of Steve Strazza @Sstrazza and Alfonso Depablos @AlfCharts Our International Hall of Famers list is composed of the 100 largest US-listed international stocks, or ADRs. We’ve also sprinkled in some of the largest... February 3, 2023 All Star Charts Premium Premium Stocks ASC Strazza Alfonso International Hall Of Famers Members Only Ian Culley Cotton Prepares to Cut and Run From the Desk of Ian Culley @IanCulley Forget about what Powell said or whatever you heard on the street. We’re still looking for risk assets to buy. That includes stocks and commodities. Despite the dollar... February 3, 2023 All Star Charts Premium Commodities ASC Ian Commodities Weekly Members Only Patrick Dunuwila Daily Chart Report ? Friday, February 3rd, 2023 February 3, 2023 The Chart Report Daily Chart Report Front Top Content Featured Stories Pagination Back 1 … Page 389 Page 390 Page 391 Page 392 Page 393 Page 394 Page 395 Page 396 Page 397 … 836 Next Recent Episodes Thompson's Two Cents The Bull Markets Next Step December 12, 2025 Hosted by Larry Thompson The Morning Show It's Crypto Friday on The Morning Show December 12, 2025 Hosted by Spencer Israel JC Parets Steve Strazza With special guest(s) Kenny Glick Louis Sykes Larry Thompson Crypto After Dark The Most Ambitious Crypto Ever? December 11, 2025 Hosted by Louis Sykes Options Jam Session The Options Edge: Powerful Strategies for Today’s Market December 11, 2025 Hosted by Sean McLaughlin ASC Gold Rush Live Gold Rush Live! December 11, 2025 Hosted by Jason Perz Sam Gatlin The Long And Short Of It with Kenny Glick December 11th December 11, 2025 Hosted by Kenny Glick Missed it? No problem!Replays of all our past episodes are always available in the episode archives. View Episode Archives
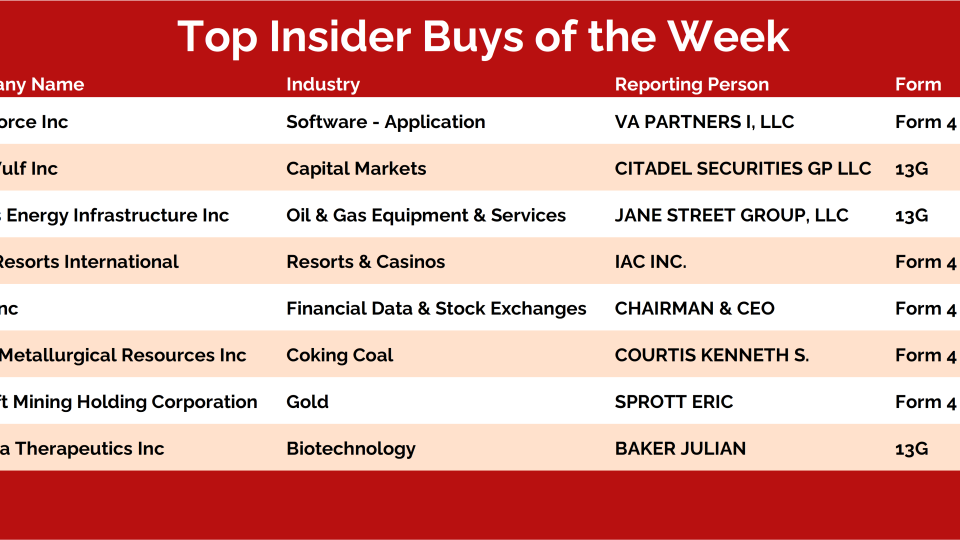
Steve Strazza Bitcoin, Baker Bros & Casinos Every weekend, I dig into our insider activity tracker looking for the biggest conviction buys — and this week checked all the boxes: Baker Bros, coal stocks, big software bets, and precious metals. Let’s take a look:... December 14, 2025 Hot Corner Insider
Ian Culley Follow The Flow (02-06-2023) From the Desk of Steve Strazza @sstrazza and Alfonso Depablos @Alfcharts This is one of our favorite bottom-up scans: Follow the Flow. In this note, we simply create a universe of stocks that experienced the most unusual... February 6, 2023 All Star Charts Premium Premium Stocks ASC Strazza Follow The Flow Alfonso Members Only
Ian Culley Under The Hood (02-06-2023) From the desk of Steve Strazza @Sstrazza. Welcome back to our latest Under The Hood column where we'll cover all the action for the week ended February 3, 2023. This... February 6, 2023 All Star Charts Premium Premium Stocks ASC Strazza Under The Hood Grant Members Only
Ian Culley [PLUS] Weekly Top 10 Report From the desk of Steve Strazza @Sstrazza Our Top 10 Charts Report was just published. In this weekly note, we highlight 10 of the most important charts or themes we’re currently seeing in asset classes around the world. ... February 6, 2023 Strazza plus Top 10
Ian Culley [PLUS] Weekly Momentum Report & Takeaways From the desk of Steve Strazza @Sstrazza Check out this week's Momentum Report, our weekly summation of all the major indexes at a Macro, International, Sector, and Industry Group level. By analyzing the short-term... February 6, 2023 Strazza plus momo
Ian Culley [Video] Gold Rush: Levels to Watch as Metals Correct It's the weekly Gold Rush! This week Strazza and I highlight critical levels to keep on your radar in the coming days and weeks. Check it out... February 6, 2023 All Star Charts Premium All Star Charts Gold Rush ASC Gold Strazza Ian Gold Rush Video Members Only
Ian Culley Gold Hits Supply: Precious Metals Levels to Know From the Desk of Ian Culley @IanCulley The dollar is back and on the move. After falling for four straight months, the US dollar index $DXY is up three days in a row. Whether the near-term dollar strength turns into a more... February 6, 2023 All Star Charts Premium All Star Charts Gold Rush ASC Gold Ian Gold Rush Members Only
JC Parets Swing Trader Pro: Afternoon Briefing (02-06-2023) From the Desk of Kimmy Sokoloff The market was down but pretty much range-bound today. It was hard to gain traction on the long side, and I was stopped out... February 6, 2023 Stocks Swing Trader Pro Newsletter
JC Parets Weekly Market Notes: Bull Market Behavior From the desk of Willie Delwiche. The number of stocks making new lows remains negligible. Last week, the number of stocks making... February 6, 2023 willie plus Notes Market Notes
Patrick Dunuwila Chart of the Day - Monday, February 6th, 2023 February 6, 2023 The Chart Report TCR Chart of the Day $DXY US Dollar Brian Joyce
Sean McLaughlin [Options Premium] Semis Are Leading Abroad As Well We're already long some domestic semiconductor stocks via options (the trend is working). However, perhaps we've set our sights too close to home. International stocks have been on a tear recently, showing even greater strength than the U.S.... February 6, 2023 All Star Options Options Options Premium Members Only
Ian Culley Gold Hits Supply: Precious Metals Levels to Know From the Desk of Ian Culley @IanCulleyThe dollar is back and on the move.After falling for four straight months, the US dollar index $DXY is up three days in a row. Whether the near-term dollar strength turns into a more... February 6, 2023 ASC Gold Rush Report
Louis Sykes Waiting for the Perfect Setup Over the last week, we've seen some mild profit-taking, with Bitcoin and Ethereum chopping around following retests of critical resistance levels. Our thesis remains that a structural shift has occurred, with the short- and intermediate-term... February 6, 2023 All Star Charts Crypto Crypto Crypto Blog Members Only
Sean McLaughlin [Options P2P] Adjustment to EEM Position We've adjusted a position in the Paid-to-Play portfolio today: February 6, 2023 Options Paid to Play Paid To Play Members Only
JC Parets Ryan Cohen Reveals a Large JWN Stake Both Icahn School of Medicine at Mount Sinai and CMLS Holdings LLC filed Form 4s for a combined amount of $40 million in GeneDx Holdings Corp $WGS. Activist investor and retail industry entrepreneur... February 6, 2023 Stocks Strazza The Hot List
JC Parets Swing Trader Pro: Morning Briefing (02-06-2023) From the Desk of Kimmy Sokoloff I mentioned in Friday's Morning Briefing that if $SPY really breaks below 412.88, we can see 408. SPY traded in that range this morning. Currently, 408 is support. If we... February 6, 2023 Stocks Swing Trader Pro Newsletter
JC Parets February is Like A Bad Hangover Stock market bulls have been rewarded over the past 3 months. And remember, historically these are the best 3 months of the year - November through January. And then comes the hangover. Think about those last three months.... February 6, 2023 Stocks Currencies ASC ASC Chart of the Day
JC Parets The U.S. Is The Worst "I only trade U.S. Stocks, JC" "If you can't find a stock in America to buy you're not... February 5, 2023 Stocks ASC
JC Parets The Median Stock Breaks Out The Value Line Geometric is one of the more underappreciated indexes that we have at our disposal. The Dow is the OG, the S&P500 is the benchmark and the Nasdaq gets... February 5, 2023 Stocks ASC ASC Chart of the Day
JC Parets Saturday Morning Chartoons: Bull Market Continues This is the weekly post that aggregates all the charts we put together throughout the week and organizes them all into one, easy to flip through deck. ... February 4, 2023 All Star Charts Premium Stocks ASC ASC Chart of the Day Members Only
JC Parets Most new 52-wk highs in over a year I remember last year getting yelled at and trolled online because I was talking about breadth improvement. Just because their stupid computers weren't telling them that it... February 4, 2023 Stocks ASC breadth ASC Chart of the Day
Ian Culley [Video] What the FICC?: A Friday Triple Play It's the weekly commodity edition of What the FICC? Since I've been under the weather this week, I wanted to share three of my favorite charts from the entire FICC space heading into the weekend. Check it out! February 3, 2023 Commodities youtube ASC Ian Commodities Weekly Video
Alfonso De Pablos, CMT International Hall of Famers (02-03-2023) From the desk of Steve Strazza @Sstrazza and Alfonso Depablos @AlfCharts Our International Hall of Famers list is composed of the 100 largest US-listed international stocks, or ADRs. We’ve also sprinkled in some of the largest... February 3, 2023 All Star Charts Premium Premium Stocks ASC Strazza Alfonso International Hall Of Famers Members Only
Ian Culley Cotton Prepares to Cut and Run From the Desk of Ian Culley @IanCulley Forget about what Powell said or whatever you heard on the street. We’re still looking for risk assets to buy. That includes stocks and commodities. Despite the dollar... February 3, 2023 All Star Charts Premium Commodities ASC Ian Commodities Weekly Members Only
Patrick Dunuwila Daily Chart Report ? Friday, February 3rd, 2023 February 3, 2023 The Chart Report Daily Chart Report Front Top Content Featured Stories
The Morning Show It's Crypto Friday on The Morning Show December 12, 2025 Hosted by Spencer Israel JC Parets Steve Strazza With special guest(s) Kenny Glick Louis Sykes Larry Thompson
Options Jam Session The Options Edge: Powerful Strategies for Today’s Market December 11, 2025 Hosted by Sean McLaughlin


