From a directional standpoint, there currently aren't any stock ideas on the board that are getting me excited to get involved in either direction. Bear markets can do that.
However, from an options premium selling point of view, there are...
The largest insider transaction on today's Hot List is a Form 4 filing by the co-founder and director of Coinbase Global $COIN, Fred Ehrsam, who reported an additional $25 million purchase of his own stock.
The largest insider transaction on today’s list is a Form 4 filing by the media holding company National Amusements, which reported a $20 million purchase of Paramount Global $PARA.
National Amusements now owns over 32 million shares of PARA,...
The level of transparency in Bitcoin and crypto as an asset class allow us to gain deep and actionable insights that aren't possible in traditional markets.
Key Takeaway: The disconnect between what investors say and what they do continues to be overlooked by sentiment indicator tourists. While consumer sentiment (what they say) is near its...
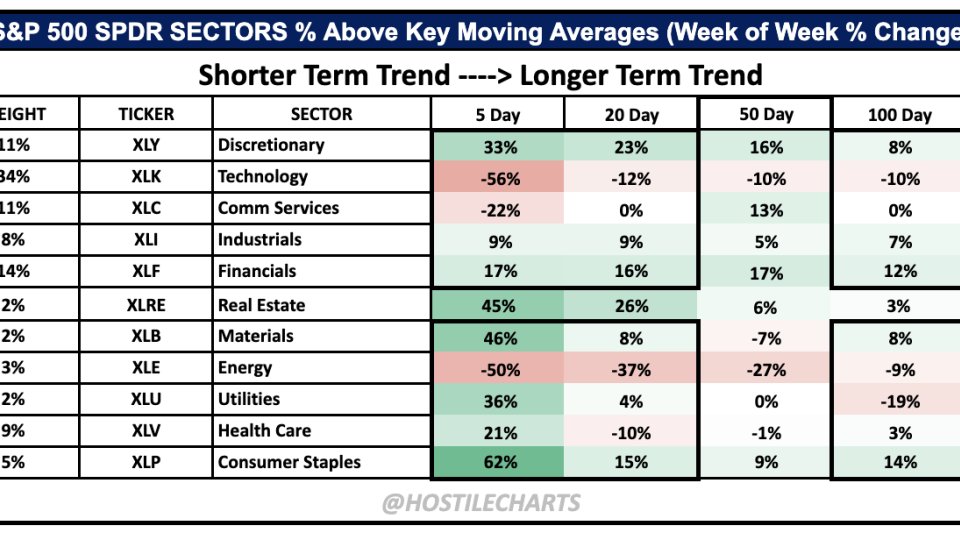
The team at All Star Charts lately has been talking about how a lot of stocks are displaying declining moving averages and share prices continue to trade below these downward-sloping moving averages. There is nothing bullish about that.