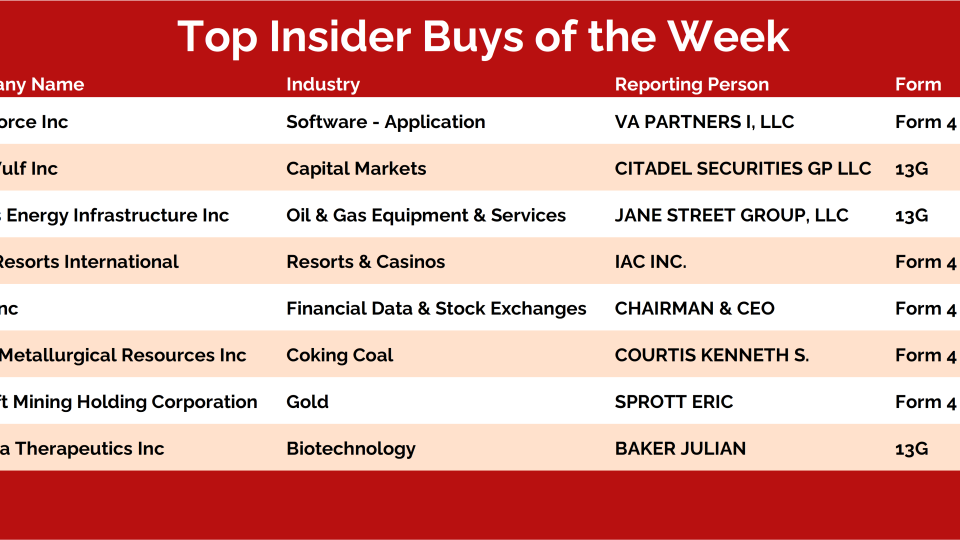
Displaying 12001 - 12024 of 17386

Is The Commodity Supercycle Extravaganza Here?

February 24, 2021

We've been talking about Commodities and a possible upcoming supercycle in this asset class.

The reason we're inclined to this view is that we're seeing signs of this on several different charts across the globe. Now when that happens, we've got to sit up and notice.

Remember when the unthinkable happened and Crude Oil traded below zero? Entertaining as it may be (to some) such extreme readings on the chart tend to act as signals for the future.

Take a look at the chart below. It is the S&P500 relative to the inverted ratio of the CRB Index (Cap-Weighted Commodity Index). The long-term chart below suggests that the extreme negative readings that we saw in Crude Oil seem to have probably sealed the top in this ratio. Can Commodities begin their outperformance going forward? It's quite likely. The individual constituents certainly look like they're ready for a good move!

Click on chart to enlarge view.

It is important to note here that we're looking at commodities like base metals...

Going for Platinum!

February 24, 2021

Our album is #1!

Oh wait, not that kind of platinum. We're talking about the metal. The guys on the ASC team are starting to get pretty geeked out about the metals space --- with good reason. Prices. Are. Breaking. Out. Sometimes it's just this simple.

Mystery Chart (02-23-2021)

February 23, 2021

From the desk of Steve Strazza @sstrazza

Check out our latest Mystery Chart!

What we do here is take a chart that's captured our attention and remove the x/y-axes as well as any other other labels that'd help identify it. This chart can be any security of any asset of any timeframe - on absolute or relative basis.

Maybe it's a ratio, a custom index, or maybe price is inverted. It could be all three!

The point is, when we aren't able to recognize what's in front of us, we put aside any biases we may have and scrutinize it objectively.

While you can try to guess the chart, the point is to make a decision...

So let us know what it is… Buy, Sell, or Do Nothing?

[PLUS] Weekly Sentiment Report

February 23, 2021

From the desk of Willie Delwiche.

Key takeaway: Optimism remains elevated when looking at investor positioning (equity ETFs have seen a quarter trillion dollars of inflows since the end of Q3) and demand for call options (up 60%+ over the past year). But sentiment concerns become more acute (and stocks more vulnerable) when optimism shows evidence of meaningfully unwinding. This week’s featured sentiment chart (ratio between HYG and LQD) suggests that rather than pushing back from the buffet and beginning to tighten their belts, investors continue to have a robust risk appetite. That doesn’t preclude an uptick in market volatility, but it reduces the risk of sustained weakness at this point.

Sentiment Chart of the Week: HYG/LQD Ratio and S&P 500

Stretched optimism becomes more problematic once risk appetites reverse & the HYG/LQD ratio suggests this is not yet the case. In fact, this ratio is more consistent with the healthy commencement of a new uptrend.


Credit Is Fine. Buy Stocks.

February 23, 2021

It's not about a virus or any economic reports. It's about Credit.

We've said it before and we'll say it again.

Look at last year, for example. By the time the S&P500 finally put in its high in February, everything else had already been falling apart. Small-caps, Mid-caps, Micro-caps, Financials, Transportation, Emerging Markets, New Highs list, Advance-Decline Line, the Value Line Index and S&Ps relative to its alternatives had all been pointing to stocks falling.

There was more data early last year suggesting to be completely out of stocks, and in bonds instead, than before any other crash in stock market history. We discussed this last week.

But even if you ignored all of those factors. And you just looked credit, you would have seen Treasuries significantly outperforming the rest of the bond market. Credit told you:

All Star Charts Premium

Under The Hood (02-22-2021)

February 23, 2021

From the desk of Steve Strazza @Sstrazza.

Welcome back to our “latest Under The Hood” column for the week ending February 19, 2021. As a reminder, this column will be published bi-weekly moving forward, and rotated on-and-off with our new Minor Leaguers column.

In this column, we analyze the most popular stocks during the week and find opportunities to either join in and ride these momentum names higher, or fade the crowd and bet against them.

We use a variety of sources to generate the list of most popular names. There are so many new data sources available that all we need to do is organize and curate them in a way that shows us exactly what we want: A list of stocks that are seeing an unusual increase in investor interest.

Whether we’re measuring increasing interest based on large institutional purchases, unusual options activity, or simply our proprietary lists of trending tickers… there is a lot of overlap.

The bottom line is there are a million ways to skin this cat. Relying on our entire arsenal of data...

All Star Charts Premium

RPP Report: Review. Preview. Profit. (02-22-2021)

February 23, 2021

From the desk of Steve Strazza @sstrazza

At the beginning of each week, we publish performance tables for a variety of different asset classes and categories, along with commentary on each.

Looking at the past helps put the future into context. In this post, we review the absolute and relative trends at play and preview some of the things we’re watching to profit in the weeks and months ahead.

Every major asset class on Earth continues to illustrate risk-taking behavior on the part of market participants.

Yields, Oil, Equities, Base Metals, the Australian Dollar -- there's an overwhelming amount of new highs in offensive areas of the market right now. The weight of the evidence continues to suggest that we want to be buyers, not sellers, of stocks.

The same bullish developments and themes that we've been pounding the table on for months continue to reinforce our stance. Some examples: the rotation into SMIDs, breadth...

[PLUS] Weekly Market Notes & Breadth Trends

February 22, 2021

From the desk of Willie Delwiche.

Key Takeaway: After record strength, breadth is taking a well-deserved breather.

This has the hallmarks of digestion more than divergence, especially after recording yet another breadth thrust. Re-opening optimism is running high and bond yields around the world are climbing.

With earnings and economic expectations still being revised higher, the path of least resistance for stocks remains higher even if we are starting to see a few more tripping hazards.

The Financials sector took over the top spot in our large-cap relative strength rankings even though leadership has not been as evident at the mid-cap and small-cap level. Our industry group heat map shows that while banks are improving at all cap-levels, no Financials-related industry groups are near the top of the rankings. Energy climbed into the third spot in our rankings, strength that is supported at the mid-cap & small-cap level. Technology remains in the leadership group, but...

Commodities Put The Pedal To The Metal

February 22, 2021

From the desk of Steve Strazza @sstrazza and Ian Culley @ianculley

We just revised and updated our Commodities chartbook and there probably couldn't have been a better time as we believe we've just entered the early innings of a new Commodities Supercycle

As we reviewed each passing chart our bullish thesis on commodities was reinforced as the same overarching theme became clearer and clearer... Everything seems to be trending higher!

With a slew of massive bases, bullish breakouts, and major trend reversals, this once left-for-dead asset class is now demanding investors' attention.

And participation continues to expand as we're seeing strength across all subgroups. From base metals to grains and softs, it's all working.

Now let's dive into a few charts that illustrate this theme. 

[Chart of the Week] Equally-weighted Precious Metals

February 22, 2021

Last Summer when Gold ran into those former highs from 2011, it only made sense for price to recognize that overhead supply that had been in place for close to a decade prior. Even if only temporarily, that was big time resistance way back when, sending precious metals tumbling. So to ignore that seemed irresponsible (see Sept 3rd Conference Call).

Now, at the time we did not know how long this process would take, or if it was even necessary. No one knew. My suspicion, at the time, was that it could take months, maybe even quarters. But maybe longer, or perhaps would never even break out at all. I didn't know. No one did.

So we sat back and waited while basically every other asset class on earth ripped higher, except bonds. So you could have owned pretty much anything but gold and treasury bonds and done great since Labor Day.

Now, while the market has punished owners of gold, it's treated Platinum...

But What If We're Wrong?

February 22, 2021

What does the market environment look like if stocks are under pressure, and loading up on stocks is probably a bad idea?

Well, I'd argue we'll probably stop seeing new highs in Aussie Dollar and US 10-yr Yields:

Let's Have A Good Laugh Together

February 22, 2021

It's hard not to laugh a little when we say ridiculous things like,

Regional Bank Stocks continue to be the market leaders during this Global Pandemic...."

Especially in front of a group of investors who think they're smart.

This is like the "least smart" comment you can make, according to some circles...

Market Strategy Health Check-Up

February 22, 2021

Introspection is a great quality to have. While a lot of introspection goes into life in general, many market participants fail to identify their errors because they do not review their actions in the market. The one thing that needs to be clear is that no new money is being created in the market. The money is simply shifting hands.

All Star Charts Premium

Broker-Dealers Break Out

February 22, 2021

From the desk of Steve Strazza @sstrazza and Louis Sykes @haumicharts

In a recent post discussing cyclicals, we posed the following question:

Are Energy and Financial stocks about to lead the market?

Cyclical groups are catching all the right tailwinds in this environment.

Crude Oil and Yields are pressing to new 52-week highs as investors continue to favor more economically-sensitive stocks and commodities in general. This is a bullish development and supports higher prices for some of the most beaten-down risk assets... even Financials and Energy.

As participation has expanded, we've been vocal about looking for the winners in each group without a sector bias based on relative strength.

The reason for this is simple... In a market where everything seems to be trending higher on an absolute basis, we want to put less emphasis on looking for leadership groups and...

[PLUS] Weekly Momentum Report

February 21, 2021

From the desk of Steve Strazza 

Don't miss this weeks Momentum Report; our weekly summation of all the major indexes at a Macro, International, Sector and Industry Group level. As a reminder, we analyze this shorter-term data within the context of the structural trends at play.


This Is Going To End Badly

February 20, 2021

When you really dive in and see what's going on, it becomes quite obvious that this will end in disaster for many investors.

Do you know why?

Because that's what always happens.

So what?

Why is that our problem?

What does that have to do with investing and helping my family?

If you take maybe just 30 seconds to study history, you’ll find that most uptrends were not bubbles. They were just uptrends.

There were things that happened this month and even last year that have never happened in the market before. There were even some events that only occurred a few times in history.

So what?

Every month and every year we see the market do things that it's never done before, or maybe has done very rarely.

...