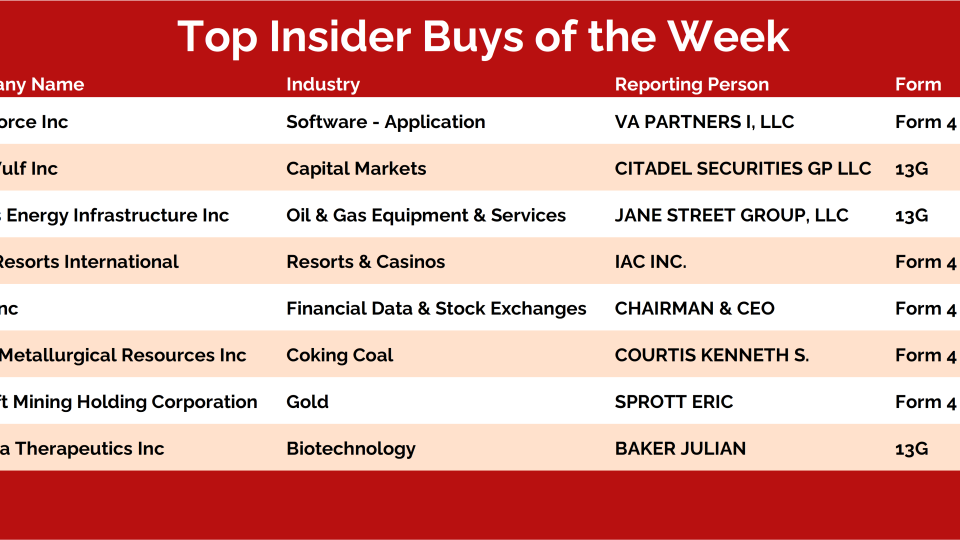
There has been a lot of risk in the stock market over the past 2 months and that still has not changed. Things are getting worse, not better. I tried to emphasize in this week's Live Call that we have NOT seen any evidence to suggest that the worst of the selling is behind us.
We've been inundated with emails from Financial Advisors and traders all over the world. From New York to London, South Africa, Malaysia, Laguna Beach they keep coming in. We work really hard and it is so nice to see how much we've been able to help people, both pros and every day hard working individuals. Thank you from all of us at Allstarcharts! We don't take these notes for granted even for a second.
We know times are tough for some people right now. I have friends and family that lost their jobs today. I'm seeing it outside of markets.
On Monday, I laid out my plan for entering into $SPY Iron Condors steadily throughout the week. I entered into the final Iron Condor this morning and wanted to give you a little update on where we stand with them.
Just as we focus on the strongest markets and stocks to find opportunities during equity bull markets, we look to identify the weakest areas during bear markets. We just want to be in the strongest trends, regardless of their direction.
A few weeks ago we ran some statistics to highlight US stocks that were bucking the trend during the selloff, as those would be the areas to focus on if/when equities eventually regained their footing. While many names have fared well, we were a bit early as the market soon broke below our risk management levels, putting us in a position where we no longer want to be long stocks.
As the selling has accelerated recently, we thought it prudent to do a deep dive into World Equity Markets to see where the strength and weakness is, as well as what these indexes are telling us about global breadth. Now that the structural picture has changed for equities it is time to start considering some of the weaker areas around...
Warning signals were piling up throughout 2020, but weak breadth has been an underlying issue for Indian stocks since they made new highs in August 2016.
While we wait for breadth and momentum divergences to form and suggest getting aggressive on the long side, we're going to look back at how the average Nifty 500 stock has performed over the last 3.5 years and why this data is relevant to today's market.
For those new to the exercise, we take a chart of interest and remove the x/y-axes and any other labels that would help identify it. The chart can be any security in any asset class on any timeframe on an absolute or relative basis. Maybe it’s a custom index or inverted, who knows!
We do all this to put aside the biases we have associated with this specific security/the market and come to a conclusion based solely on price.
You can guess what it is if you must, but the real value comes from sharing what you would do right now. Buy,Sell, or Do Nothing?
We are not seeing any evidence of a bottom for stocks, yet. In these sorts of scenarios we want to see improvements in market breadth and/or bullish momentum divergences start to pile up. We're not seeing any of either.
In times like this, where many stocks, indexes and sectors, are in what we call "no-man's land", it helps to find non-correlated assets to analyze and perhaps invest in.
One thing that does NOT move up and down with the US Stock Market is Natural Gas. Evidence of this lack of correlation can be seen throughout 2019, for example, as Natty Gas got crushed while US Stocks soared.
I'll start by saying: this is no ordinary week. But you knew that.
If you are sitting on the sidelines, waiting for all this craziness to subside, that is not a bad idea at all. There is no reason to put our money at risk if we can't get a handle on our own emotions during this highly uncertain time.
That said, for those who are willing to wade into these choppy waters with me -- these insane premiums offer us the ability to sell premium FAR away from current prices. I'll share with you my simple game plan for this week.