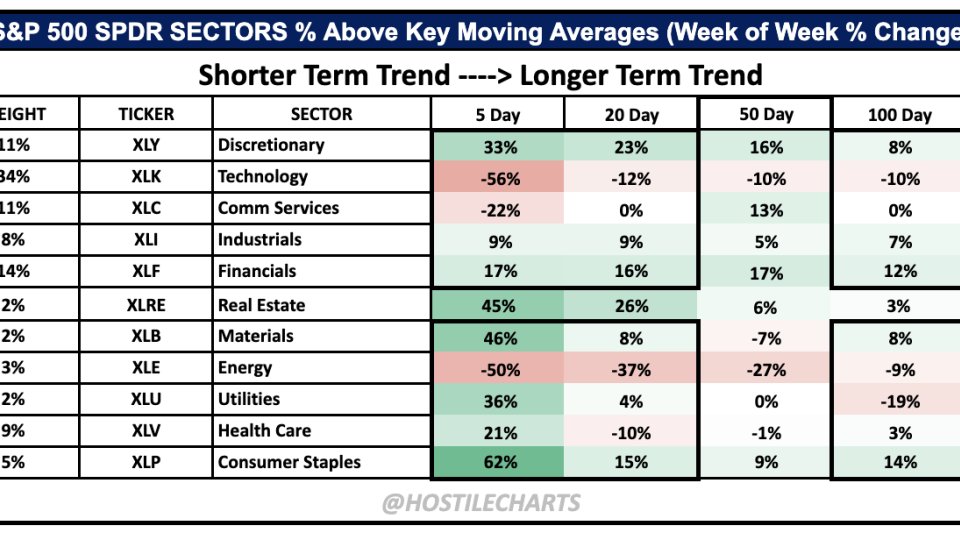
Displaying 11449 - 11472 of 17409

[PLUS] Weekly Observations & One Chart for the Weekend

June 4, 2021

From the desk of Willie Delwiche.

While new highs are being seen around the world (Europe, Frontier Markets) and in the US (Broker/Dealers, Real Estate, Energy), there is still plenty of attention on former leaders who are trying to reclaim their lost glory. A great example of that is the ARK Innovation ETF (ARKK). This fund peaked at the height of speculative fever in February and has since made a series of lower highs and lower lows. It’s now dealing with rejection as its latest rally attempt petered out shy of the confluence of the 50 and 200-day moving averages. When viewed in context of overall declining NASDAQ volume, it suggests stronger hands have been selling to weaker hands and they are the ones that are going to be left paying the tab at the end of the night. 

All Star Options

[Options Premium] Living in 3D

June 4, 2021

The team at All Star Charts has started putting out a new report called "Follow the Flow." The goal of this report is to "create a universe of stocks that experienced the most unusual options activity – either bullish or bearish… but NOT both."

The unusual activity we're witnessing in these stocks is not necessarily "smart" money, but "aggressive" or "motivated" money. This is a useful signal.

With this in mind, one of the names mentioned in the most recent report caught my eye for a shorter duration bullish options bet.

All Star Charts Premium

6 Shorts For The Summer

June 4, 2021

With the Dow Jones Transportation Average hitting our upside targets last month, it's become a wait and see game. 

Are consolidations resolving higher, like they were before? Or are they resolving lower?

Based on the overwhelming amount of evidence, the bet we want to make as that Transports resolve lower, and join some of the other areas that have already been under pressure for months, like Tech and Small-caps.

When going through the components of this index, there were 6 names in particular that presented the best risk vs reward opportunities on the short side.

The first one Southwest Airlines. This looks like a top to me. How I learned it was to buy the smiley faces and sell the frowny faces.

If we're below 59, we want to be short $LUV with a target near 48.50, which represents all that former resistance last year.

...

Heroes And Zeros

June 4, 2021

There is now more than enough evidence to say with certainty that digital currencies are here to stay.

In the last few quarters, the market has spoken. The size of some of these coins is mind-blowing.

What was once peanuts, the total market cap of the asset class achieved the $2T milestone at its peak last month.

There are literally several thousands of options or individual coins/tokens to express our opinions, and the list is growing every day.

So the number of options and ease of access is only accelerating the interest and activity in the space. We don't see this changing.

Where did all the Bears Go? Uh oh...

June 3, 2021

The greatest trick the market ever pulled was convincing growth investors that they weren't in a bear market....

You can really see it in this week's AAII Poll, which shows the FEWEST amount of bears since January 2018.

One thing I've learned, is that when the bears run out, the market has a funny way of creating some:

The Tactical Trend And How We're Trading It

June 3, 2021

We can highlight as many charts and Altcoins as we like to demonstrate where things could be leaning, but with most things in markets, less is often more.

In this case, it's straightforward.

If 60% of the asset class, namely Bitcoin and Ethereum, can breakout from their current consolidations, the short-term trend is likely up, and it'd be wise to put some risk back onto the table.

Alternatively, if they cannot, and these patterns resolve lower - we should anticipate messier action for longer.

Hopping onto the Energy Express

June 3, 2021

Over the past few days, we've seen the market resolve higher. With the new all-time high in place, we're seeing one sector witness growing strength.

Energy has been a part of the sectors that have been showing strength for some time now. However, there are a few stocks that are now joining the bandwagon of the 'breakout express' and this seems like a good time to jump aboard!

To start off, let's take a look at the Energy index and see what we've got there. Nifty Energy has clocked a new all-time on the Monthly timeframe. Needless to say, that is a big positive! So what are the levels that we're watching? Well, from a slightly longer-term view (we're looking at monthly charts, remember?), if Energy continues to chug on higher, we're looking at a target close to 23,825.

Click on chart to enlarge view.

Now let's dive into the stocks.

First up, let's take a look at a recommendation that has come up in our analysis in the past.

Gujarat Gas has been a part of our trade ideas as recently as the...

[PLUS] Weekly Sentiment Report

June 2, 2021

From the desk of Willie Delwiche.

Key takeaway: Sentiment continues to shift away from optimism and toward pessimism, though as with anything it is not a straight line. Speculative activity is flaring up again this week, the trend in trading volumes and call activity suggests less risk appetite on the part of investors. Optimism unwind is happening in the context of elevated longer-term risks, with earnings growth expectations and valuations at elevated levels. A sideways summer that cools optimism and helps relieve valuation pressures could help pave the way for the resumption of a cyclical rally later this year.

Sentiment Report Chart of the Week: Diminishing Highs

As optimism fades, so does the number of new 52-week highs in the S&P 500. It takes bulls to make a bull market, and from a tactical perspective, our sentiment and breadth measures suggest the bulls have already left for summer vacation.


[Options] Monthly Positions Review -- May

June 2, 2021

Once again this month, I'm going to share info on positions that were closed in the month of May. As a reminder, our exit plans are always laid out ahead of time in each trade idea we publish. In every case, the exits mentioned below were all exited in accordance with the plan as laid out.

Polkadot's Canary In The Coal Mine

June 2, 2021

To gauge any market trend, we must look under the surface at the components themselves.

This is true for Stocks, Commodities, Bonds, and even Cryptocurrencies. It's Universal.

For instance, when discussing Smart Contract Platforms like Polkadot or Ethereum, we evaluate whether the bulls are diving deep into the projects of the other offerings in the ecosystem.

This is Technical Analysis 101, and it goes back to Charles Dow in the 1800s looking for confirmation of the major averages.

Over 130 years later, in entirely new assets, the same principles govern markets.

In this case, we're looking at Polkadot's first project release and Canary Network, Kusama $KSM.

Similar to how Litecoin is seen as the experimental little brother to Bitcoin, any new additions to be implemented on Polkadot go through Kusama first.

For this reason, the two trade very much in tandem.

So how about this divergence?

The All Star Momentum Scan

June 2, 2021

We debuted a new scan recently which goes by the name- All Star Momentum.

All Star Momentum is a brand new scan that pinpoints the very best stocks in the market. This time around, we have incorporated our stock universe of Nifty 500 as the base. Among the 500 stocks that we follow, this scan will pump out names that are most likely to generate great returns.

While we go through our lists of sectors and stocks on a weekly basis, we thought of launching a product that would highlight the names that are the strongest performers in our universe and those that are primed for an explosive move.

Just like The Outperformers scan, this is a list of stocks belonging to the sectors that display relative strength in the market at any given point in time. Since sector rotation is the lifeblood of a bull market, we will be ahead of the curve before the gears keep shifting.

Market Rise Amid Low Participation

June 2, 2021

We put out a post recently about the breadth indicators picking up bullish signals. This was when Nifty 50 was attempting to move past its earlier high of 15,431.

Well, what do we have now? In addition to keeping track of the participation in the general market scenario, it is increasingly important to track the same indicators when new highs are claimed.

Nifty 50 managed to move past its resistance, but what do the breadth indicators say?