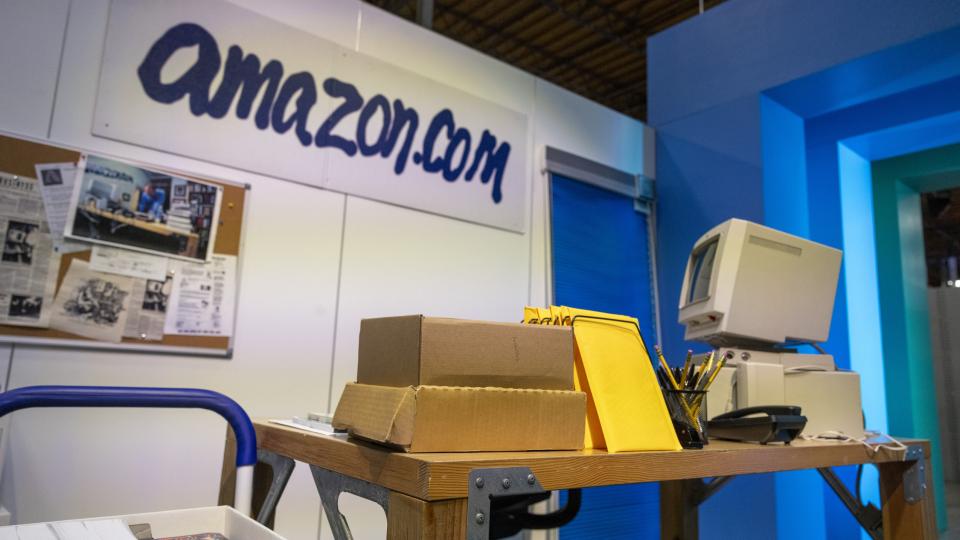
From the desk of Steven Strazza @Sstrazza and Ian Culley @Ianculley
Lumber futures have been on an absolute tear since last spring. The vertical but volatile price action off last year's lows is something for the history books.
After trading down to 250 in late March of 2020, Lumber has since shot back above 1,600, where it trades today. It’s no wonder social media is full of people flaunting their wealth with stacks of timber.
But we have to ask... is it time for a pullback? Is this rally overdone here?
Let’s take a deeper look and discuss why we believe the logical move for Lumber over the short term is sideways... or even lower.
Here’s the chart. Look at that face ripper - up nearly 7x in just over a year!
Lumber futures just barely sliced through our target of 1,636 last week, yet have fallen back below that level in recent sessions.
The one chart is actually two charts this week. On the left is the S&P 500 and the percentage of stocks in that index that are above their 200-day average (90%). On the right is the NASDAQ Composite and the percentage of stocks in that index that are above their 200-day average (50%). The contrast could hardly be more stark. Even as weakness has been seen in some of the largest sectors (like Technology), the S&P 500 is being supported by ongoing strength in cyclical values areas. The NASDAQ has little to no exposure to those sectors that are doing the best right now and is bearing the brunt of speculative excesses being unwound (the collapse in equity call options is evidence of this shift).
I planted most of the vegetables for the garden over the past couple of weeks. Seeds and seedlings. Neat rows and clustered groups. Into the raised beds they went.
I don't know what the day to day (or week to week) fluctuations in the weather will be. But I do know that it is (finally) Spring. Planting as the air temperature rises and our daylight hours expand increases the likelihood of a bountiful garden later this summer. Leafy greens (kale, arugula, chard) were the first into the soil. They can withstand cooler temperatures than the cucumbers, peppers and tomatoes.
As a gardener, I have some understanding of the underlying trends and conditions that guide the seasons. Plant too soon and a late frost will kill off tender seedlings. Plant too late and the summer heat will sap the strength of plants without well-developed root systems.
It's about knowing the growing environment, managing temperature risks and finding opportunities to increase vegetable production.
Some might dismiss this as a farmer’s market timing. I call it prudent.
These are the registration details for our live monthly conference call for Premium Members of All Star Charts.
This month’s Conference Call will be held on Monday May 24th at 6PM ET. As always, if you cannot make the call live, the video and slides will be archived and published here along with every other live call since 2015.
But there are still areas of the market with strong & expanding internals. Breadth data continues to be mixed just like we’re seeing from many asset classes right now.
What we do here is take a chart that’s captured our attention, and remove the x and y-axes as well as any other labels that could help identify it.
This chart can be of any security, in any asset class, on any timeframe. Sometimes it’s an absolute price chart, other times it’s on a relative basis.
It might be a ratio, a custom index, or maybe the price is inverted. It could be all three!
The point is, when we aren’t able to recognize what’s in front of us, we put aside any biases we may have and scrutinize the price behavior objectively.
While you can try to guess the chart, the point is to make a decision…
So let us know what it is… Buy, Sell, or Do Nothing?
Something we’ve been working on internally this year is using various bottoms-up tools and scans to complement our top-down approach. One way we’re doing this is by identifying stocks as they climb the market-cap ladder from small, to mid, to large, and ultimately to mega-cap status (over $200B).
Once they graduate from small-cap to mid-cap status (over $2B) they come on our radar. Likewise, when they surpass the roughly $30B mark, they roll off our list.
But the scan doesn’t just end there. We only want to look at the strongest growth industries in the market as that is typically where these potential 50-baggers come from.
Some of the best performers in recent decades – stocks like Priceline, Amazon, Netflix, and Salesforce, to a myriad of others… all would have been on this list at some point during their journey to becoming the market behemoths they are today.
When you look at the stocks in our table you will notice we...
Inflation surprise points brings new pressure on portfolios tilted toward yesterday
With bond & stock returns more likely to struggle, expand investment opportunity set
Commodity exposure poised to do well as inflation picks up and yields rise
The headlines are filled with stories of higher prices for pretty much everything (have you tried to buy a used car recently) and our charts show widespread strength in commodities (beyond just the headline grabbing moves in lumber and copper. Still, this morning’s CPI report managed to surprise many. The headline CPI was up 0.8% in April, versus an expected increase of 0.2%, and the core CPI was up 0.9% in the month, versus an expected increase of 0.3%. That was the largest monthly increase in the core CPI since 1982. The core CPI is now up 3.0% over the past year, the largest such change since 1996. While this may be due in part to various...
Three days off the highs for the S&P 500 and twitter traders are acting like the sky is falling. And maybe it is? But at times like these, I like to look for opportunities to fade what often prove to be short-lived spikes in volatility.
And the best way I know how to do this is to look at sector ETFs and observe the ones displaying the highest relative implied volatilities.
The Outperformers is our newest scan that pinpoints the very best stocks in the market. It’s the fastest, easiest way to find quality names that are primed for major moves.
The goal is that as the market rally progresses, the sector rotation within the market will reflect in this scan. So while our Top/Down Analysis helps us with the broader view of the market, this Bottom/Up scan makes sure that we catch the slightest change in sentiment.
Well, Nifty 50 is really not interested in that statement because it continues to remain messy. But in this messy move, we've seen certain sectors outperform the others. One among the outperformers is the Pharmaceutical sector.
Are there any new breakouts in the sector constituents? A few, yes.
Let's do a deep dive in this sector and see what comes up.
Key takeaway: A peak within the NASDAQ (or the Technology sector) shows that pockets of speculative excesses are being unwound. There has been enough strength in the market elsewhere, as well as a still favorable earnings and economic data backdrop, to keep investors generally optimistic. In March, market volatility allowed optimism to retreat from excessive levels but not completely unwind. We may be seeing early indications that the current bout of volatility will have a more substantial impact on investor psychology. If so, the price reaction will likely not be as benign as was seen two months ago.
Sentiment Report Chart of the Week: Unwinding Speculative Fervor
The Nasdaq has been the leader off the March 2020 lows during the speculative beta chase that ensued. However, excessive optimism has come off a full boil and it shows in pockets of breadth deterioration seen in the former leader. While more than 40...
We've been talking about this for a long time: this year is NOT last year.
The things that worked for the last 3 quarters of 2020 are not working in 2021. Stocks are a mess. Growth is a massive underperformer. Small-caps can't stop churning sideways. Defensive assets stopped going down. Gold is going up. Consumer Staples are outperforming. The nasdaq is the weakest of all the indexes.
None of these things remind me of last year at all.
We discussed all this and more on Yahoo Finance this morning:
From the desk of Steve Strazza @Sstrazza and Ian Culley @Ianculley
Is the US Dollar Index $DXY on the brink of completing a massive reversal pattern to the downside?
As more evidence comes into the picture, it's looking increasingly dire for the dollar. In fact, we're seeing it trend loweracross all timeframes against almost all of its peers.
And this action has only gained steam over the last week as DXY has plunged to fresh multi-month lows.
Dollar weakness has been a nice tailwind for risk assets since its peak in March of last year. Any additional downside pressure in the coming weeks, months, and even quarters would not surprise us... especially if this daunting double-top pattern breaks lower. If and when this happens, further weakness from both a tactical and structural standpoint is exactly the bet we'll be making.
Let's dig deeper and look at what actually drives the DXY. By looking at the various crosses that make up the index, we gain insight in terms of building a directional bias for DXY. This process also provides a weight of the evidence...
This is a fun one. I got to sit down with Paul Ciana to talk about all things Fixed Income, Commodities and Currencies. Paul is now the Chief Global FICC Technical Strategist and Director of Research at Bank of America Merrill Lynch. But in the early days, him and I used to study for our CMTs together back in 2006.
What's nice about this is that in his current position, and for 10 years at Bloomberg prior to his 5 years at BofA, he's had the opportunity to speak to many of the largest portfolio managers in the world. I want to know what he's learned from all those conversations!
Paul always gives great perspective and as you know, the macro view carries a big weighting throughout our process. So this episode really hit home.
I took advantage and just hit him with all my favorite questions and topics in the FICC world. And he just chuckled and happily answered most of them.