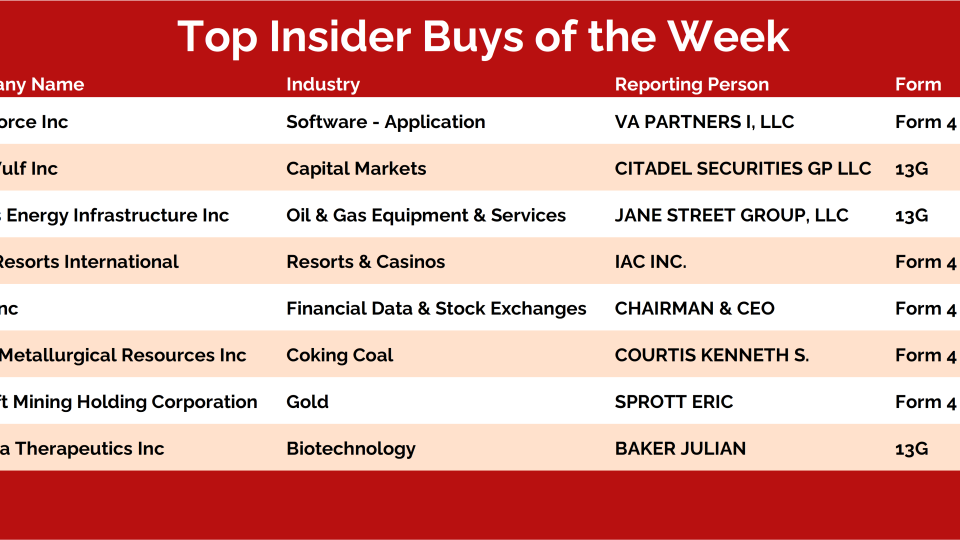
What's the one thing that's on everyone's mind today? What has caught your attention today? Or rather, what has demanded your attention today?
The Tata Group of course! Such a move hasn't come along in this group in the longest time. A post dedicated to this group is definitely the need of the hour.
The Tata Group is synonymous with Trust, Integrity, and Loyalty. There is a certain feel-good factor added to the group based on the people at the helm and their activities. While there is a place for everything, once you look at price action, nothing else matters.
That's the beauty of Technical Analysis I guess. It encompasses all possible pieces of information and presents to you a price level that reflects everything. Quite powerful, when you really think about it.
So here we are today, taking a look at a reputable conglomerate that has been making money for investors for years together!
Since there are so many constituents in this group, I don't think it qualifies to be a Solar System. I feel it's a whole Universe by itself.
So what do we like in this universe at the moment?
We debuted a new scan recently which goes by the name- All Star Momentum.
All Star Momentum is a brand new scan that pinpoints the very best stocks in the market. This time around, we have incorporated our stock universe of Nifty 500 as the base. Among the 500 stocks that we follow, this scan will pump out names that are most likely to generate great returns.
While we go through our lists of sectors and stocks on a weekly basis, we thought of launching a product that would highlight the names that are the strongest performers in our universe and those that are primed for an explosive move.
Just like The Outperformers scan, this is a list of stocks belonging to the sectors that display relative strength in the market at any given point in time. Since sector rotation is the lifeblood of a bull market, we will be ahead of the curve before the gears keep shifting.
Crude oil is at its highest level since 2014 after it took out resistance around 76.
Energy stocks just ripped off of support and are back above a key level of resistance, trading at highs not seen since early 2020.
Economically sensitive commodities and cyclical stocks, in general, remain very well bid.
Meanwhile, the mainstream media is hung up on narratives surrounding stagflation and the possibility of a global recession. But we’re just not seeing this at all when we look at price.
Risk assets are performing as well as they have all year. And, when we look outside the US, while there’s definitely been selling pressure around the world, the areas that stick out all seem to have something in common.
The energy-dependent countries are showing leadership.
This supports the recent price action from energy futures and stocks, many of which have been ripping to fresh highs.
In today’s post, we'll take a look at some international equities we can use to express a bullish thesis on higher oil prices -- and higher prices for risk assets more broadly.
From the desk of Steve Strazza @Sstrazza and Ian Culley @Ianculley
All eyes have been on the US dollar as it presses to new 52-week highs.
But its recent rally hasn’t been accompanied by the usual risk-off behavior we’d expect. Actually, it’s been quite the opposite.
Bonds have been rolling over, commodities and cyclical stocks continue to march higher, and the yen can’t catch a bid.
To us, the evidence suggests the USD is momentarily decoupling from its classic intermarket relationships as it grinds higher in the face of all this.
If the US dollar is out of sync with the action in other asset classes, where can we look within the currencies market for a clear perspective of investors’ attitudes toward risk?
That’s right... the yen!
Let’s look at a couple of charts highlighting the Japanese yen’s weakness and discuss what it means for the current market environment.
First up is the classic risk-appetite barometer, the AUD/JPY cross:
Analysts and economists no longer chasing reality higher
Downward earnings revisions coming with stocks priced for perfection
Persistent inflation and higher bond yields would be a new experience for many investors
The past year has been one of widespread earnings surprises and large upward revisions. Whether those trends can remain intact as Q3 earnings season gets underway is one of the more important questions the market has to wrestle with right now. Expectations are elevated going into the quarter, but a number of the factors that fueled the earnings strength of the past year are starting to ebb. I have my suspicions that Q3 earnings season will be a repeat of the recent past.
At the end of the day, price is what pays. We don’t want to forget that, but we also want to keep an eye on whether (and how) investors’ expectations are being met or not. In each of the first two quarters of 2021, the earnings growth rate at the end of earnings season was nearly 30...
Over the last few months, we've focused on names trading above their spring highs.
Along with this simple message, we've included this chart featuring four prominent names right at their highs from earlier in the year:
We're putting so much effort into this setup for two reasons:
All-time highs are achieved in the strongest of assets.
Buying new highs allows us to define our risk.
First, bases take time to build.
Bases of this magnitude are formed by accumulation from people with a lot of money that needs to be put to work. Institutions -- or, in the case of crypto, whales -- need liquidity to enter long-term spot positions. They don't have the luxuries of more nimble traders who are able to enter and exit at will and start long-term positions when momentum heats up on a breakout.
They need liquidity, and there's plenty of it when retail capitulates and sells their coins down in bear markets.
Unlike what university professors will argue, prices don't fall under a normal distribution,...
And now it's the opposite. Sentiment is a tailwind for stocks.
Take a look at the sentiment from Financial Advisors and Individual investors. Just a few months back, we saw the most amount of bulls since January 2018, just before stocks all over the world plummeted.
All it took was half the nasdaq stocks dropping 20% for sentiment to mean revert. Take a look at this chart showing that we're down to levels where bulls historically start showing up, and that's usually because of an increase in stock prices:
Our Top 10 Charts Report was just published. In this weekly note, we highlight 10 of the most important charts or themes we're currently seeing in asset classes around the world.
Cyclicals Shine
In recent week’s we’ve witnessed a slew of former leadership groups -- mostly growth sectors, achieve our targets and begin to roll over. This might have been a more concerning development if we weren’t witnessing value and cyclical stocks pick up their slack so aggressively. Over the past couple of weeks, we’ve seen energy stocks rebound and make a swift move off support as well as financials rally back to fresh all-time highs. More recently, we’re now seeing industrials and materials dig in and rally off their year-to-date lows. Once again, the bears had some charts looking vulnerable, and failed to make their move. Now it appears that bulls are back in the driver seat and value stocks are poised to take on some leadership. This theme is illustrated well by the strength in our equal-weight custom cyclical index, below.
This is one of our favorite bottom-up scans: Follow The Flow. In this note, we simply create a universe of stocks that experienced the most unusual options activity — either bullish or bearish… but NOT both.
We utilize options experts, both internally and through our partnership with The TradeXchange. Then, we dig through the level 2 details and do all the work upfront for our clients. Our goal is to isolateonlythose options market splashes that represent levered and high-conviction, directional bets.
We also weed out hedging activity and ensure there are no offsetting trades that either neutralize or cap the risk on these unusual options trades. What remains is a list of stocks that large financial institutions are putting big money behind… and they’re doing so for one reason only: because they think the stock is about to move in their direction and make them a pretty penny...
Key Takeaway: Energy and Financials looking for friends. Bonds remain under pressure, with German yields rising toward the highest level since 2019. Breadth is no longer a relative laggard.
Energy and Financials switched spots this week but remain at the top of the relative strength rankings, with leadership evident across time frames and market cap levels. Over the past three months, no other sector is up more than 1%. The Financials sector is up 6% and Energy is up 8%.
Our industry group heat map shows notable strength in Energy and Banks. Health Care, Technology and Telecom groups are coming under pressure.
Check out this week's Momentum Report, our weekly summation of all the major indexes at a Macro, International, Sector, and Industry Group level.
By analyzing the short-term data in these reports, we get a more tactical view of the current state of markets. This information then helps us put near-term developments into the big picture context and provides insights regarding the structural trends at play.
Let's jump right into it with some of the major takeaways from this week's report:
* ASC Plus Members can access the Momentum Report by clicking the link at the bottom of this post.
Macro Universe:
This week, we saw our macro universe lean positive as 62% of our list closed higher with a median return of 0.51%.
Lumber $LB was the big winner, closing out the week with a gain of more than 15% and registering a fresh 13-week high.
The biggest loser this week was the Volatility Index $VIX, with a loss of -11.25%.
This week, we saw no change in the percentage of assets on our list within 5% of their 52-week highs (currently at 47...
We’ve already had some great trades come out of this small-cap-focused column since we launched it late last year and started rotating it with our flagship bottom-up scan, “Under The Hood.”
We recently decided to expand our universe to include some mid-caps…
For about a year now, we’ve focused only on Russell 2000 stocks with a market cap between $1 and $2B. That was fun, but we think it’s time we branch out a bit and allow some new stocks to find their way onto our list.
The way we’re doing this is simple…
To make the cut for our new Minor Leaguers list, a company must have a market cap between $1 and $4B. And it doesn’t have to be a Russell component–it can be any US-listed equity. With participation expanding around the globe, we want all those ADRs in our universe...
Shame on me for using the word "Hope" in the headline for this post, but I cannot resist a good pun ;)
We've got a play here in an old school Aerospace & Defense company that is on the verge of making new all-time highs. And it just so happens it's approaching the magical $100 a share price point that often tends to act as a price magnet. We call this the hundred-dolla-roll!
Scouring our charts this morning, we couldn't help see that a lot of coins are getting tight out there.
With this volatility contraction, a big move could be on the cards, in either direction...
Big names like Cardano and Avalanche are wedged in contracting consolidation patterns. The resolution from these will likely set the stage for the coming weeks ahead.
And when we look to Bitcoin, prices have been in a very tight range, and this morning seems to be breaking higher.
Compressions like these tend to proceed quick and violent moves, just like the volatility contraction that we were writing about at the end of July before Bitcoin's monster rally off its lows.
Given that the primary trends are higher across every major crypto asset, the higher likelihood scenario is that we do see upward resolutions in the coming days.
Looking at Bitcoin, if prices are above their September highs of 53,000, we need to remain aggressively long with a...
This week we’re looking at a long setup in the Auto sector. We're seeing strength come through in the Auto segment and thought of taking a look at a stock that's ripe for a bullish move.
We retired our "Five Bull Market Barometers" in mid-July last year to make room for a new weekly post that's focused on the three most important charts for the week ahead.
This is that post, so let's jump into this week's edition.
One of the first things you learn in Technical Analysis is that markets are fractal.
That means that you'll find the same human behaviors (i.e. price patterns) whether you're looking at daily timeframes, weekly time frames or even intraday (e.g. 10-min or 30-min candles).
This is a concept that Brian Shannon has done an amazing job of highlighting throughout his career. Brian has been an inspiration to me since about 2005, which is pretty unbelievable to think about. Since then we've become friends and go skiing together and all that. It's pretty cool how life works sometimes.
Anyway, the idea behind "Multiple Timeframes", which is literally part of the title of Brian's book (go buy it), is to use this reality of "markets being fractal" to our advantage.
That can mean a lot of different things to different people.
For us, in what we do here at All Star Charts is, we start with Weekly and Monthly time horizons. That's where it all begins.
We've been discussing Covid for so long now, that it feels as though it's been going on forever. It carried out massive damage across different segments. But we are now seeing a resumption in trends that have been in place long enough to call them trends.
As we know, travel had been largely affected by the pandemic. Getting out of the house to buy groceries became the new travel plan! But not anymore!
We're now witnessing a strong and consistent pick-up in flight and hotel bookings which means that we can start taking a look at the shares that belong to these categories as well!
So let's do just that.
First up, let's take a look at the custom Leisure Index that we track at ASC.
As can be seen from the chart below, the custom Leisure Index is at a crucial level. Currently trading close to its 2019 highs, the index seems ready to break out soon. And why is it that we think so?
Because there are signals that are coming through from the constituents of the index that suggest so.