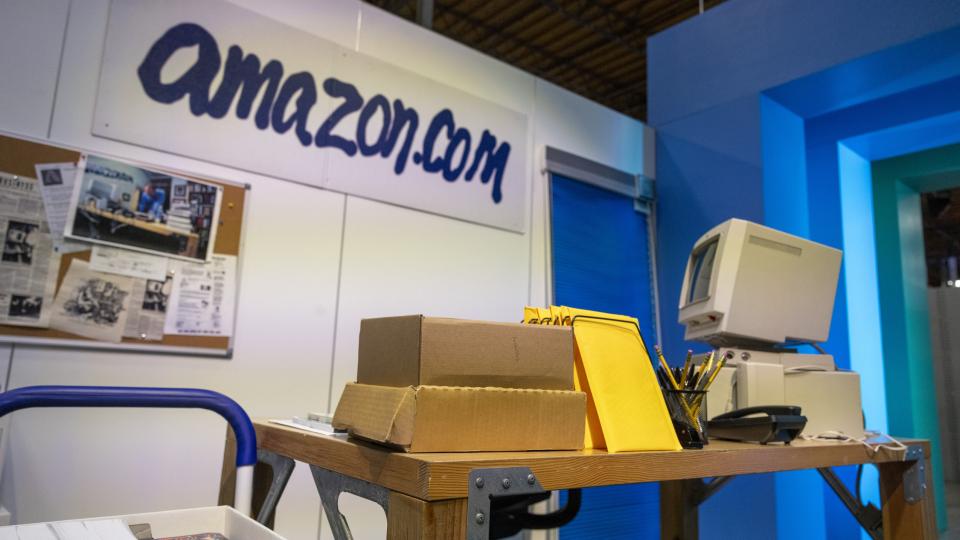
Our International Hall of Famers list is composed of the 50 largest US-listed international stocks, or ADRs. We’ve also sprinkled in some of the largest ADRs from countries that did not make the market cap cut.
These stocks range from some well-known mega-cap multinationals such as Toyota Motor and Royal Dutch Shell to some large-cap global disruptors such as Sea Ltd and Shopify.
It’s got all the big names and more -- but only those that are based outside the US. You can find all the largest US stocks on our original Hall of Famers list.
The beauty of these scans is really in their simplicity.
We take the 50 largest names each week and then apply technical filters in a way that the strongest stocks with the most momentum rise to the top.
Let’s dive in and take a look at some of the most important stocks from around the world.
From the desk of Steven Strazza @Sstrazza and Ian Culley @Ianculley
Commodities are streaking higher, providing plenty of alpha across the entire space to anyone who can pry their eyes away from their altcoin charts.
Cotton and coffee continue to rip. Crude oil and the energy space are grinding higher. Live cattle are breaking out. Even precious metals are starting to catch a bid.
But what about the grain market? Last week, we pointed out that our Minneapolis Wheat position had hit our target and that it was time to feed the ducks.
Today, we’re going to highlight a couple of grain contracts we want to keep on our radar for buying opportunities in the coming weeks and months.
Let’s dive in!
First up is the March 2022 corn contract:
Like many other cyclical assets, corn futures peaked in May and have since been chopping sideways in a broad range. As the consolidation continues to develop, price has repeatedly found...
From the desk of Steven Strazza @Sstrazza and Grant Hawkridge @granthawkridge
Everything's falling into place for the bulls.
Mid-caps and small-caps finally joined their large-cap peers at new record highs earlier this month. A bullish expansion in breadth is confirming these breakouts at the index level.
We're also seeing strong confirmation in the form of other risk assets resolving above key levels of interest.
As suspected, our risk checklist has moved up to its highest level since we began tracking it this summer. This list does an excellent job summarizing the global landscape.
Here’s a look at where things stand presently:
What we’ve done here is pinpoint critical levels in some of the most risk-on markets and relative ratios in order to gauge the current level of risk appetite.
Whether these charts are above or below our levels is...
Well, once again we saw a little downside action this week and the noise-makers on the twitter and the teevee got all revved up. Cool. Whatever drives clicks, you maniacs.
Meanwhile, those of us who keep our heads about us while others are going insane are looking for opportunities to sell some premium into the somewhat elevated volatility premiums we see in options during times like this.
So, I did my periodic scan across the ETF landscape to see which sectors were sporting the highest relative implied volatilities while also showing the potential for rangebound activity over the next several weeks.
After my daughter’s flight landed in Minneapolis, she had to hurry through the terminal to catch a bus for the ride that would complete the final leg of her trip back to college. She did a great job of navigating uncertainties and asking for directions. She went where she was told and saw people, but no bus. "Just wait here," she was told, "the bus shows up, you get on, and it leaves right away."
A couple of buses came, some people got on, the buses left. Meanwhile, her ride was still a no-show.
But people who appeared to be in-the-know said she was in the right spot.
These are the registration details for our live mid-month conference call for Premium Members of All Star Charts.
Our next Live Call will be held on Tuesday November 16th at 6PM ET. As always, if you cannot make the call live, the video and slides will be archived and published here along with every other live call since 2015.
In the morning, the uptick in the CPI pushed Bitcoin immediately higher.
Throughout this short period, open interest spiked higher as longs jumped into late positions. This combined with FTX going offline contributed to a perfect storm for a minor shakeout of over-leveraged longs.
From the desk of Steven Strazza @Sstrazza and Ian Culley @IanCulley
Last week, we touched on the weakness that’s been developing further out on the yield curve.
The long end simply hasn’t kept pace with shorter-term yields. This is understandable given the magnitude of the move in the 30-year since summer 2020. At some point, the shorter end of the curve needs to play catch up. And it’s done just that these past couple months.
Now it’s time to focus on longer-term rates, as further downside pressure will eventually put the current economic recovery into question.
Let’s put the recent action in rates into perspective as we head into year’s end.
Below is a chart of the US 30-year yield:
After testing a key level of former support turned resistance around 2.23, it’s slipped back toward its summer lows.
If the 30-year yield continues to fall and takes out its former lows around 1.78 that does not bode well for...
As many of you know, something we've been working on internally is using various bottom-up tools and scans to complement our top-down approach. It's really been working for us!
One way we're doing this is by identifying the strongest growth stocks as they climb the market-cap ladder from small- to mid- to large- and, ultimately, to mega-cap status (over $200B).
Once they graduate from small-cap to mid-cap status (over $2B), they come on our radar. Likewise, when they surpass the roughly $30B mark, they roll off our list.
But the scan doesn't just end there. We only want to look at the strongest growth industries in the market, as that is typically where these potential 50-baggers come from.
Some of the best performers in recent decades – stocks like Priceline, Amazon, Netflix, Salesforce, and myriad others – would have been on this...
Key Takeaway: The bulls are back as more and more investors begin to reach for risk. Optimism is expanding across investor surveys and active equity managers have increased their exposure to levels not seen since the beginning of the year. This fresh bout of risk-seeking behavior comes as both momentum and price trends have turned bullish. Also, participation beneath the surface is expanding as the major indexes reach record highs. Combine this backdrop with a healthy number of stubborn bears and we have an environment that supports the next leg higher.
Sentiment Report Chart of the Week: Appetite For Risk Returns
Investors are not just feeling more optimistic, they are doing something about it. NASDAQ trading volume, which fell by nearly 30% from March to October, has turned higher in recent weeks and is 20% higher than it was this time last year. Equity call option activity has also expanded as investors are stepping back up to the ‘risk on’ buffet after a multi-month...
The beneficiaries of such a move would be widespread - down the cap scale of altcoins, and even in the individual stocks that are making crypto an increasing part of their operations.
So let's revisit how we're approaching the stocks in the crypto space, and identify the levels we're watching to manage risk and to take profits along the way.
We debuted a new scan recently which goes by the name- All Star Momentum.
All Star Momentum is a brand new scan that pinpoints the very best stocks in the market. This time around, we have incorporated our stock universe of Nifty 500 as the base. Among the 500 stocks that we follow, this scan will pump out names that are most likely to generate great returns.
While we go through our lists of sectors and stocks on a weekly basis, we thought of launching a product that would highlight the names that are the strongest performers in our universe and those that are primed for an explosive move.
Just like The Outperformers scan, this is a list of stocks belonging to the sectors that display relative strength in the market at any given point in time. Since sector rotation is the lifeblood of a bull market, we will be ahead of the curve before the gears keep shifting.