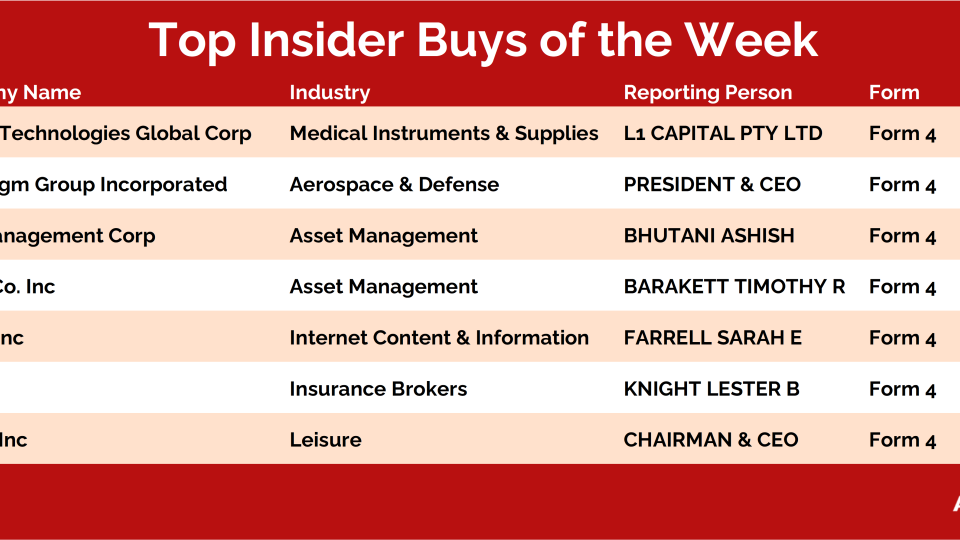
From the Desks of Ian Culley @IanCulley and Sam Gatlin @Sam_Gatlin
It’s time to buy natty gas.
A bullish momentum swing is on the verge of flashing green. And seasonal tailwinds are due to pick up as price pulls back.
Plus, the dominant four-year cycle is approaching the next expansion phase.
Buckle up!
Check out the monthly natty gas chart with a MAC-D momentum indicator in the lower pane:
The monthly MAC-D is nearing a bullish crossover at extreme oversold conditions. This long-term momentum setup occurs after cyclical lows, marking critical inflection points in 2012, 2016, and 2020.
Also, all three previous natty gas cycles hit bottom in the spring and ripped higher toward the end of summer – the start of the best three months of the year (August- October).
I expect stiff seasonal tailwinds to start whipping buyers into a frenzy by the second week of August:
Our Hall of Famers list is composed of the 150 largest US-based stocks.
These stocks range from the mega-cap growth behemoths like Apple and Microsoft – with market caps in excess of $2T – to some of the new-age large-cap disruptors such as Moderna, Square, and Snap.
It has all the big names and more.
It doesn’t include ADRs or any stock not domiciled in the US. But don’t worry; we developed a separate universe for that. Click here to check it out.
The Hall of Famers is simple.
We take our list of 150 names and then apply our technical filters so the strongest stocks with the most momentum rise to the top.
Let’s dive right in and check out what these big boys are up to.
Here’s this week’s list:
*Click table to enlarge view
We filter out any laggards that are down -5% or more relative to the S&P 500 over the trailing month.
As can be seen in the chart below, $RSG has certainly been winning over the long run. And with this week's earning report sending the down 5%, it feels like a great opportunity to get positioned on the dip.
In fact, with all the selling in big tech, i thought it would be a good day to leave the office a bit early, get outside, and let the dust settle. Come back next week fresh.
But, here I am writing… because this setup is just too good to miss.
We had an unusual options splash come across our scan just earlier in Cinemark Holdings $CNK.
We know the name well as we’ve been stalking this one for a Freshly Squeezed setup.
Cinemark Holdings has a 25% short interest and 10x days to cover ratio.
While the unusual options activity and high short interest are great, what is even more bullish is the fact CNK is in the process of completing a textbook bearish-to-bullish reversal.
Sector rotation is the lifeblood of any bull market, and we don’t expect things to be any different this time around.
After a prolonged period without progress, small caps are back in the driver's seat. The Russell 2000 just capped off a bearish-to-bullish trend reversal with a decisive resolution.
At the same time, the profit-taking in mega-cap growth stocks has been non-stop these past two weeks.
The chart below shows the Russell 2000 printing its best 5-day streak of outperformance relative to the Technology Sector… in history:
We call these kinds of moves "initiation thrusts" because it is common for them to occur at inflection points, or the beginning of new trends.
In the case of the above, this extreme reading is telling us that small caps are ready to make a turn versus big tech.
Also notice where all of this is taking place. The extreme momentum in favor of small-caps is...
The most significant insider buy on today's list comes via a Form 4 filing by the chairman and CEO of Truist Financial Corporation $TFC, William H. Rogers Jr.
Rogers reported a purchase of 57,300 TFC shares, equivalent to $2.5 million.
Liberty 77 Capital L.P bought 149,682 shares of Lions Gate Entertainment Corp $LGF.
Here’s The Hot Corner, with data from July 25, 2024:
In another Form 4, William R. Johnson, chairman of the board of directors of United Parcel Service $UPS, revealed a purchase worth $643,035.
Director Robert W. Stallings reported a purchase of 5,500 shares in Texas Capital Bancshares $TCBI.
TCBI has been carving out a base for roughly three years.
Price is pressing against the range's upper bounds as buyers absorb all the overhead supply at this resistance zone:
The big story this week has been the Ethereum ETF.
From the early data I'm seeing, it doesn't look to be as spectacular of a launch compared to the Bitcoin ETFs. But this is understandable and was expected.
Here's this week's crypto roundup. It's an opportunity for us to take a step back, set aside the distractions, and delve into the key charts shaping the crypto complex.
We love our bottoms-up scans here at All Star Charts. We tend to get really creative when making new universes as we want to be sure they will deliver us the best opportunities the market has to offer.
However, when it comes to this one, it couldn't be any simpler!
With the goal of finding more bullish setups, we have decided to expand one of our favorite scans and broaden our regular coverage of the largest US stocks.
Welcome to TheJunior Hall of Famers.
This scan is composed of the next 150 largest stocks by market cap, those that come after the top 150 and are thus covered by the Hall of Famers universe. Many of these names will someday graduate and join our original Hall Of Famers list. The idea here is to catch these big trends as early on as possible.
There is no need to overcomplicate things. Market cap is a quality filter at the end of the day. It only grows if price is rising. That's good enough for us.
The bottom line is it is a bull market. We want as many vehicles and options to express...
When you zoom in on the chart of Zoom Video $ZM you will see an intraday range that is engulfing the prior 7 trading days. Unless a lot changes in the next few hours, it should also be green with a large body.
When you zoom out, you’ll notice this couldn’t be taking place at a more critical price level. Just look at all the old lows around 60. That’s a lot of dead bodies.