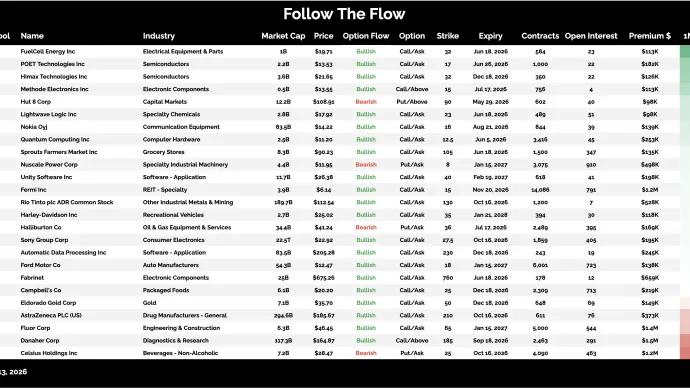
Steve Strazza The Daily Flow Quantum tech, media deals, and a power systems turnaround see massive options volume today This note highlights a select group of stocks showing the most unusual — and highly directional — options activity.The goal is simple: follow the big money and trade in the direction of the underlying... May 21, 2026 All Star Charts Premium ASC Follow The Flow Steve Strazza
Ricardo Sarraf 2 to 100 Club From the desk of Ricardo Sarraf @nullchartsEvery cycle produces a handful of stocks that go from emerging to enormous — names that compound 10x, 20x, 50x before they become portfolio fixtures. But they... May 21, 2026 2 to 100 Club All Star Charts Premium 2-to-100 Club Premium ASC Stocks Ricardo Sarraf Members Only
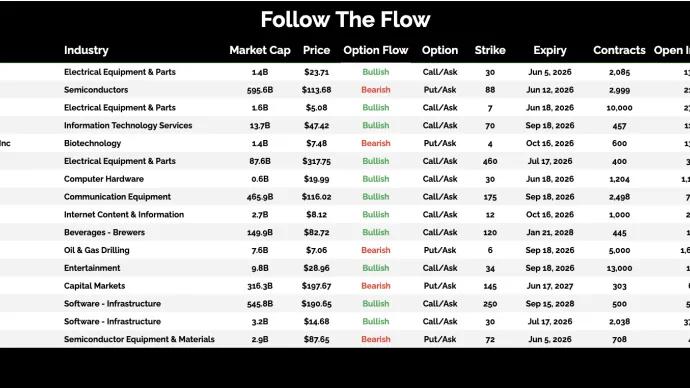
Steve Strazza The Daily Flow Crypto infrastructure, electrical equipment, and a fertility benefits comeback are attracting big money flow today. This note highlights a select group of stocks showing the most unusual — and highly directional — options activity.The goal is simple: follow the big money and trade in the direction of the underlying... May 20, 2026 All Star Charts Premium ASC Follow The Flow Steve Strazza
Steve Strazza The Daily Flow Semis, software, and travel names dominating the bullish flow today This note highlights a select group of stocks showing the most unusual — and highly directional — options activity.The goal is simple: follow the big money and trade in the direction of the underlying... May 19, 2026 All Star Charts Premium ASC Follow The Flow Steve Strazza
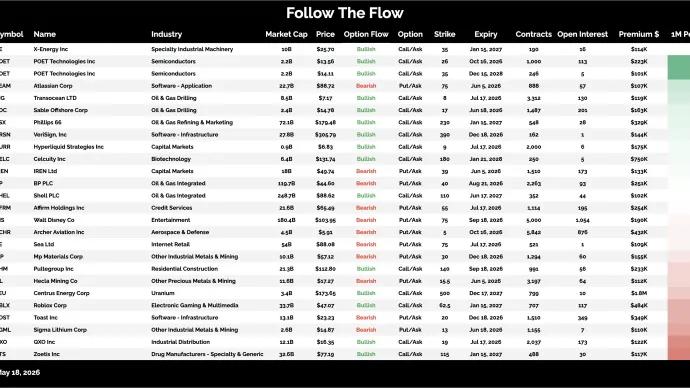
Steve Strazza The Daily Flow Offshore drillers, biotech, and eVTOL getting attention This note highlights a select group of stocks showing the most unusual — and highly directional — options activity.The goal is simple: follow the big money and trade in the direction of the underlying... May 18, 2026 All Star Charts Premium ASC Follow The Flow Steve Strazza
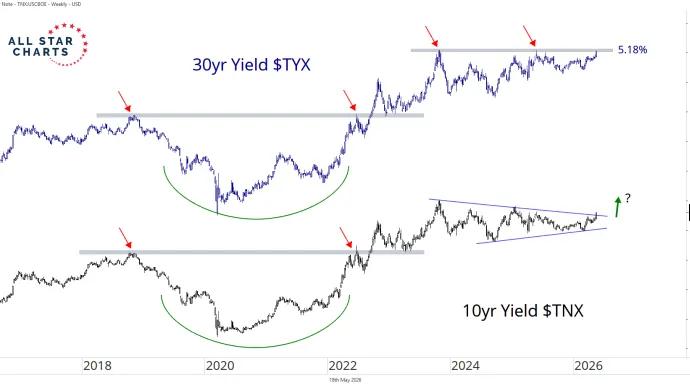
Alfonso De Pablos, CMT The Bond Market Is Moving Long-term interest rates are moving higher again.And it’s not just happening in the US. The pressure is showing up globally.In... May 18, 2026 Alfonso's Daily Note ASC Alfonso
Steve Strazza The Minor Leaguers From the Desk of Steve Strazza @SstrazzaWelcome to The Minor Leaguers.We've had some great trades come out of this small-cap-focused column since we launched it back in 2020 and... May 18, 2026 All Star Charts Premium Minor Leaguers ASC Stocks Steve Strazza Premium Small Caps Members Only
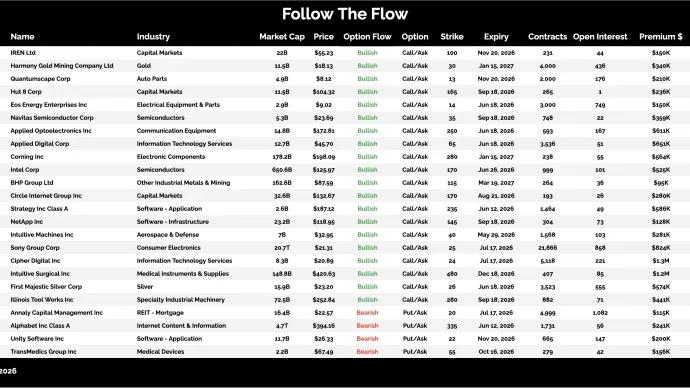
Steve Strazza Follow the Flow Every weekend I dig through the names that experienced the most interesting unusual options activity. We’re looking for trades that stood out, whether it was large in size or a very aggressive strike selection.... May 17, 2026 All Star Charts Premium ASC Follow The Flow Steve Strazza Members Only
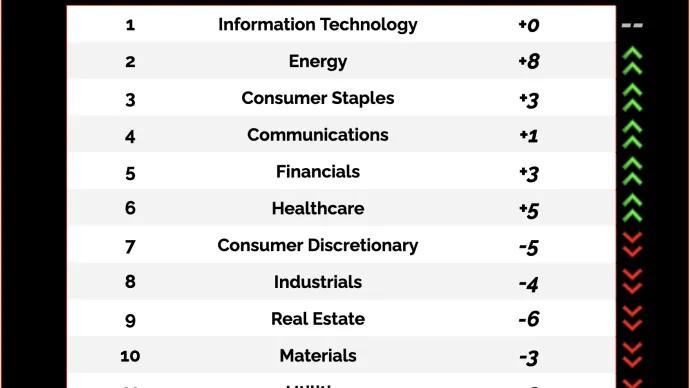
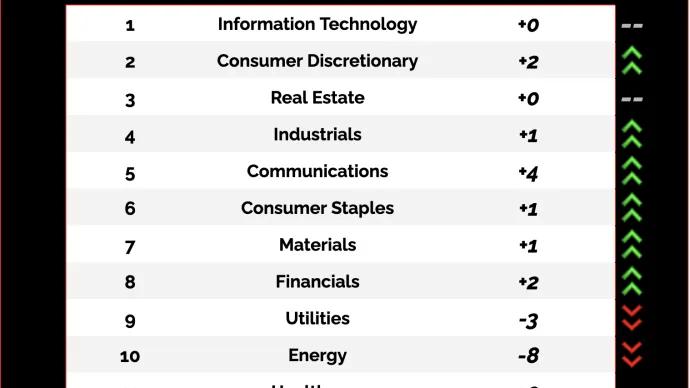
Steve Strazza Top Down Trade of the Week The market is rotating back into energy Welcome back for another Top Down Trade of the Week.This is a classic leadership scan.We start with the best sectors, then drill into the subgroups. We pick one, and then take a look at... May 16, 2026 All Star Charts Premium The Strazza Letter Strazza ASC Premium Stocks Top Down Trade Of The Week Members Only
Steve Strazza The Daily Flow Big money is buying the cloud, fading home goods, and turning bullish on solar This note highlights a select group of stocks showing the most unusual — and highly directional — options activity.The goal is simple: follow the big money and trade in the direction of the underlying... May 15, 2026 All Star Charts Premium ASC Follow The Flow Steve Strazza
Ricardo Sarraf 2 to 100 Club Monthly Members Call - May 2026 Every month, I'll be going live to members to review what's going in the 2-to-100 Universe. We'll go over open trades with levels and we'll cover the major themes in our universe. This week... May 15, 2026 2 to 100 Club 2-to-100 Club Premium ASC Stocks Ricardo Sarraf Video Members Only
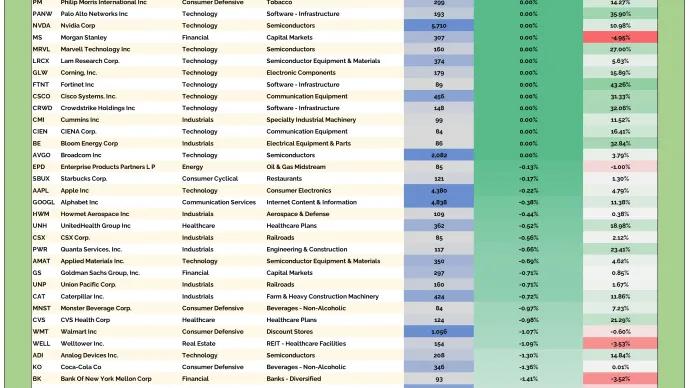
Steve Strazza The Hall of Famers From the desk of Steve Strazza @SstrazzaOur Hall of Famers list is composed of the 150 largest US-based stocks.These stocks range from the mega-cap growth behemoths like Apple and Microsoft – with... May 15, 2026 All Star Charts Premium Stocks Hall Of Famers ASC Premium Strazza Members Only
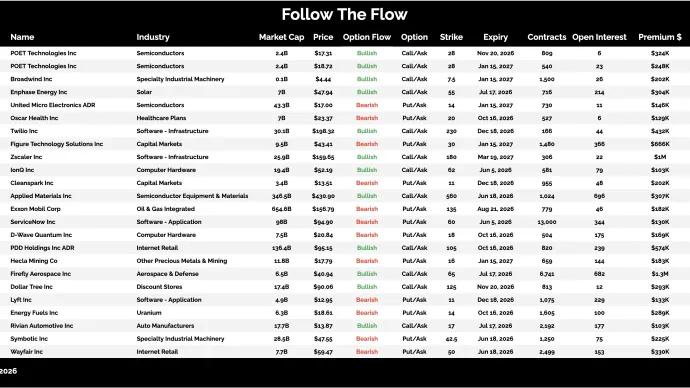
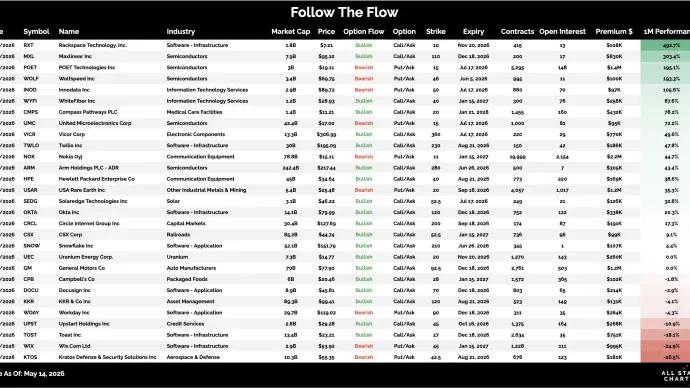
Steve Strazza The Daily Flow Software infrastructure leading, electronic components heating up, and solar quietly stirring This note highlights a select group of stocks showing the most unusual — and highly directional — options activity.The goal is simple: follow the big money and trade in the direction of the underlying... May 14, 2026 All Star Charts Premium ASC Follow The Flow Steve Strazza
Steve Strazza The Daily Flow Buyers Are Pressing Across Semis, Autos, and Construction This note highlights a select group of stocks showing the most unusual — and highly directional — options activity.The goal is simple: follow the big money and trade in the direction of the underlying... May 13, 2026 All Star Charts Premium ASC Follow The Flow Steve Strazza
Ricardo Sarraf 2 to 100 Club From the desk of Ricardo Sarraf @nullchartsEvery cycle produces a handful of stocks that go from emerging to enormous — names that compound 10x, 20x, 50x before they become portfolio fixtures. But they... May 13, 2026 2 to 100 Club All Star Charts Premium 2-to-100 Club Premium ASC Stocks Ricardo Sarraf Members Only
Steve Strazza The Daily Flow Oil royalties quietly building, biotech breaking out, and aerospace defense getting a fresh look This note highlights a select group of stocks showing the most unusual — and highly directional — options activity.The goal is simple: follow the big money and trade in the direction of the underlying... May 12, 2026 All Star Charts Premium ASC Follow The Flow Steve Strazza
Steve Strazza Ricardo Sarraf The Short Report From the Desk of Steve Strazza @Sstrazza and Ricardo Sarraf @nullchartsWhen investing in the stock market, we always want to approach it as "a market of stocks."Regardless of the environment, there... May 12, 2026 All Star Charts Premium Short Report ASC Premium Ricardo Members Only
Steve Strazza The Daily Flow Energy storage surging, gold miners running, and solid-state battery plays heating up This note highlights a select group of stocks showing the most unusual — and highly directional — options activity.The goal is simple: follow the big money and trade in the direction of the underlying... May 11, 2026 All Star Charts Premium ASC Follow The Flow Steve Strazza
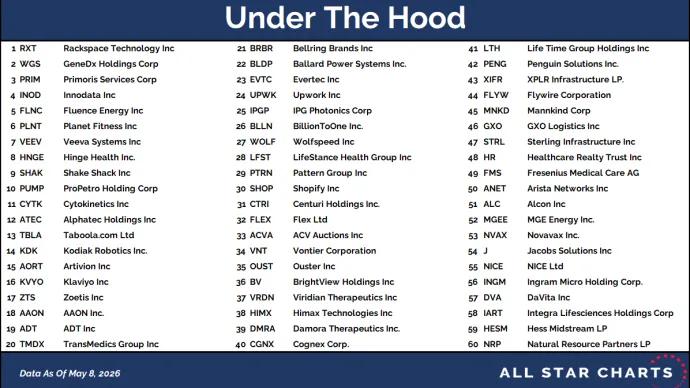
Steve Strazza Under The Hood From the Desk of Steve Strazza @Sstrazza.Welcome back to Under the Hood, where we'll cover all the... May 11, 2026 All Star Charts Premium ASC Under The Hood Stocks Steve Strazza Premium Members Only
Steve Strazza Follow the Flow Every weekend I dig through the names that experienced the most interesting unusual options activity. We’re looking for trades that stood out, whether it was large in size or a very aggressive strike selection.... May 10, 2026 All Star Charts Premium ASC Follow The Flow Steve Strazza Members Only
Steve Strazza Top Down Trade of the Week Software strikes back Welcome back for another Top Down Trade of the Week.This is a classic leadership scan.We start with the best sectors, then drill into the subgroups. We pick one, and then take a look at... May 9, 2026 All Star Charts Premium The Strazza Letter Strazza ASC Premium Stocks Top Down Trade Of The Week Members Only
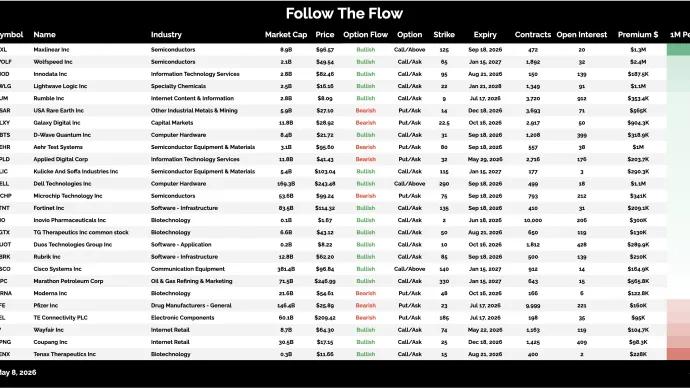
Steve Strazza The Daily Flow Photonics in hyperdrive, security software starting to move This note highlights a select group of stocks showing the most unusual — and highly directional — options activity.The goal is simple: follow the big money and trade in the direction of the underlying... May 8, 2026 All Star Charts Premium ASC Follow The Flow Steve Strazza
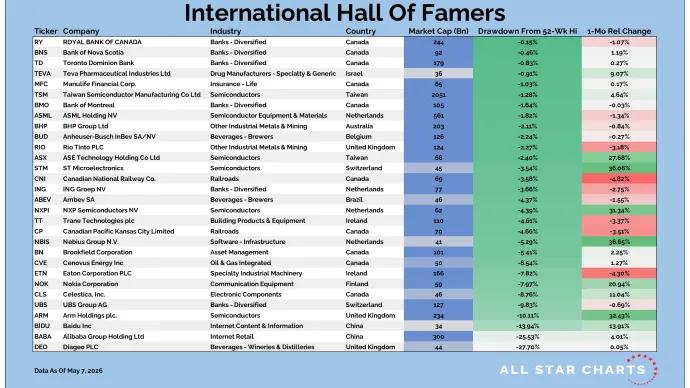
Steve Strazza International Hall of Famers From the desk of Steve Strazza @SstrazzaOur International Hall of Famers list is composed of the 100 largest US-listed international stocks, or ADRs.We've also sprinkled in some of the largest ADRs... May 8, 2026 All Star Charts Premium Strazza Stocks Premium ASC International Hall Of Famers Members Only
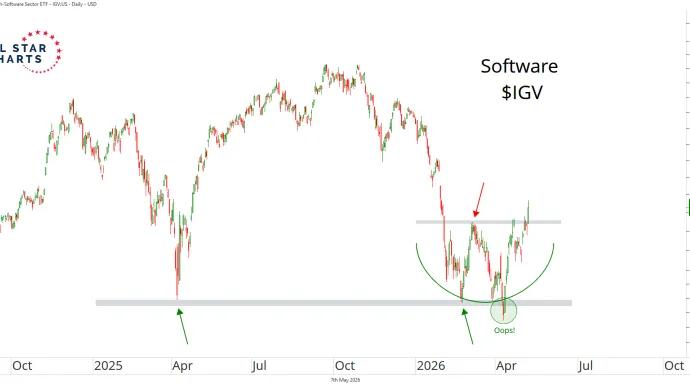
Alfonso De Pablos, CMT Rotation Into Software? Software is starting to look interesting again.After being hit hard in 2025, the group has spent most of the year repairing damage and trying to find its footing while much of the market has gone vertical.On... May 8, 2026 Alfonso's Daily Note ASC Alfonso