That’s the latest reading of our Risk-On/Risk-Off Indicator, its highest level so far this year and the strongest since November 2024.
Here’s the chart:
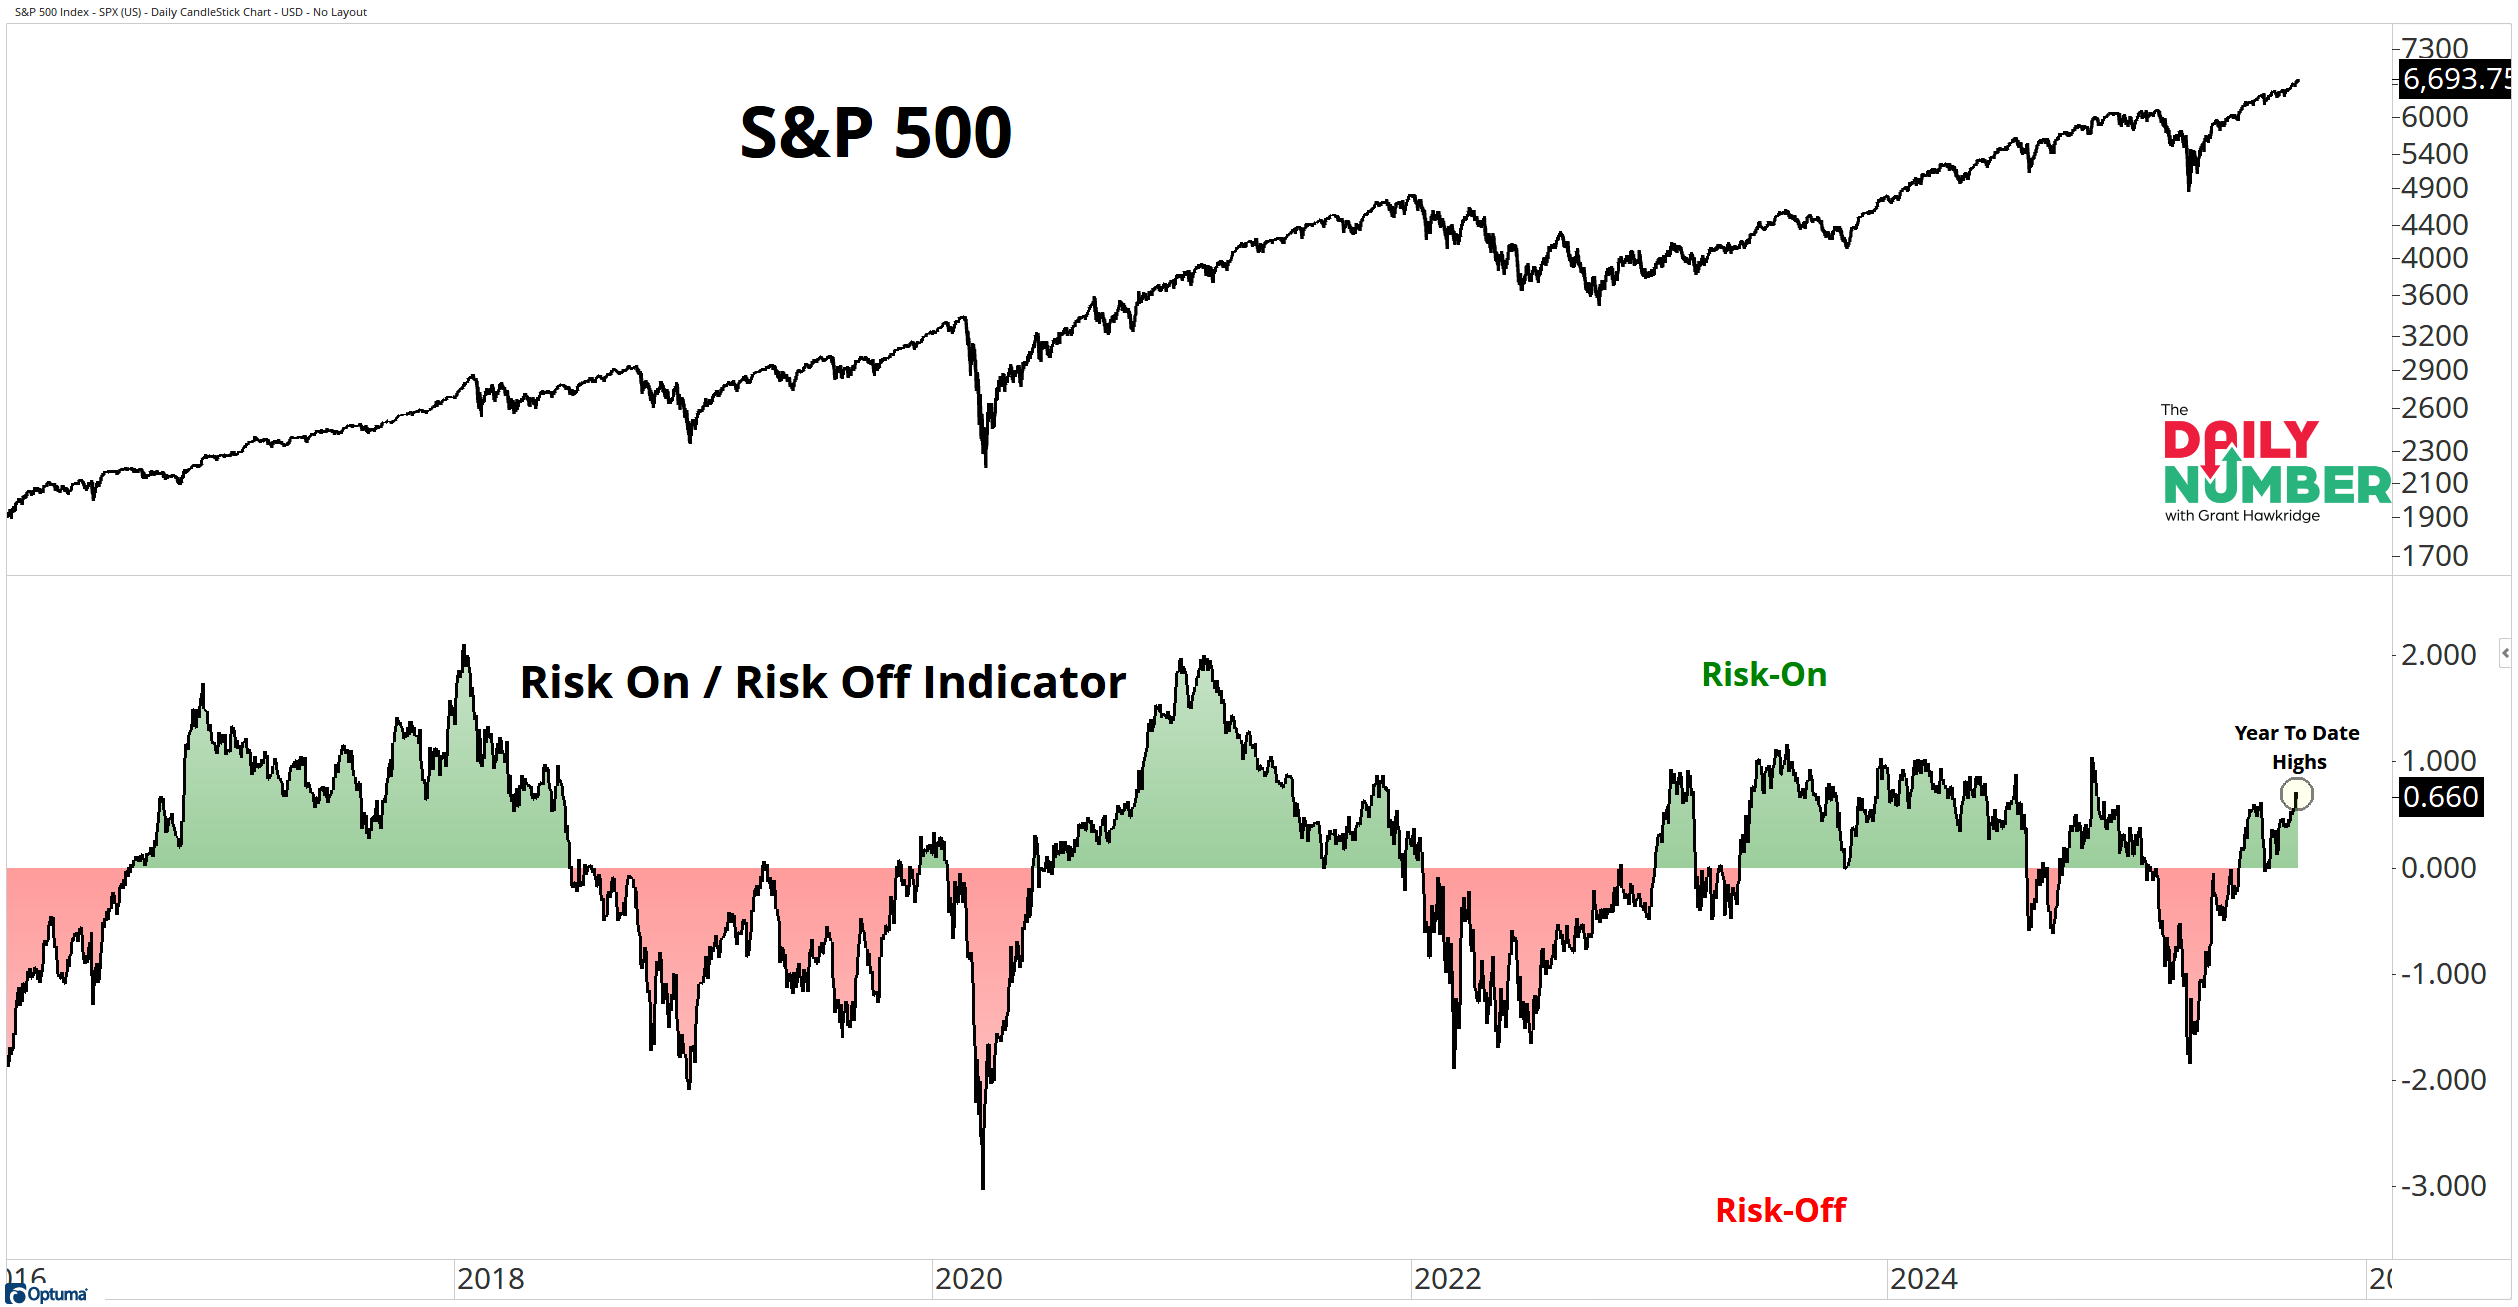
Let's break down what the chart shows:
The top panel plots the S&P 500's daily closing price in black.
The lower panel shows the Risk-On/Risk-Off Indicator, which combines 19 intermarket and intramarket ratios.
Green shading marks periods when the composite is above zero (risk-on) and red shading marks periods when it is below zero (risk-off).
The Takeaway: Risk appetite across assets is expanding.
The composite’s reading is not just a new high for 2025. It’s the most risk-on reading in nearly a year.
7 of the 19 ratios inside the model are printing 52-week highs. That is broad participation, which shows investors are leaning into cyclical and growth trades, not hiding out in safety.
This indicator has a history of getting it right. Strong moves above zero tend to align with healthy equity advances, while deep negative readings cluster around corrections.
The higher and broader the reading, the stronger the signal of underlying risk demand. It’s not just price at highs — it’s positioning too. If risk-on flows continue to expand, this uptrend still has room to run.
So, with risk appetite breaking out, how much upside is still on the table?
Grant Hawkridge | Chief Aussie Operator, All Star Charts
Need a full trading toolkit that actually helps you make moves? All Star Charts Premium gives you daily trade ideas, proprietary scans, and access to our entire analyst team. If you're serious about leveling up your strategy.
If you find my content valuable, I would greatly appreciate it if you could share it with your friends, family, and colleagues. Your help in spreading the word is invaluable in supporting our work. Thank you to all of you who share!