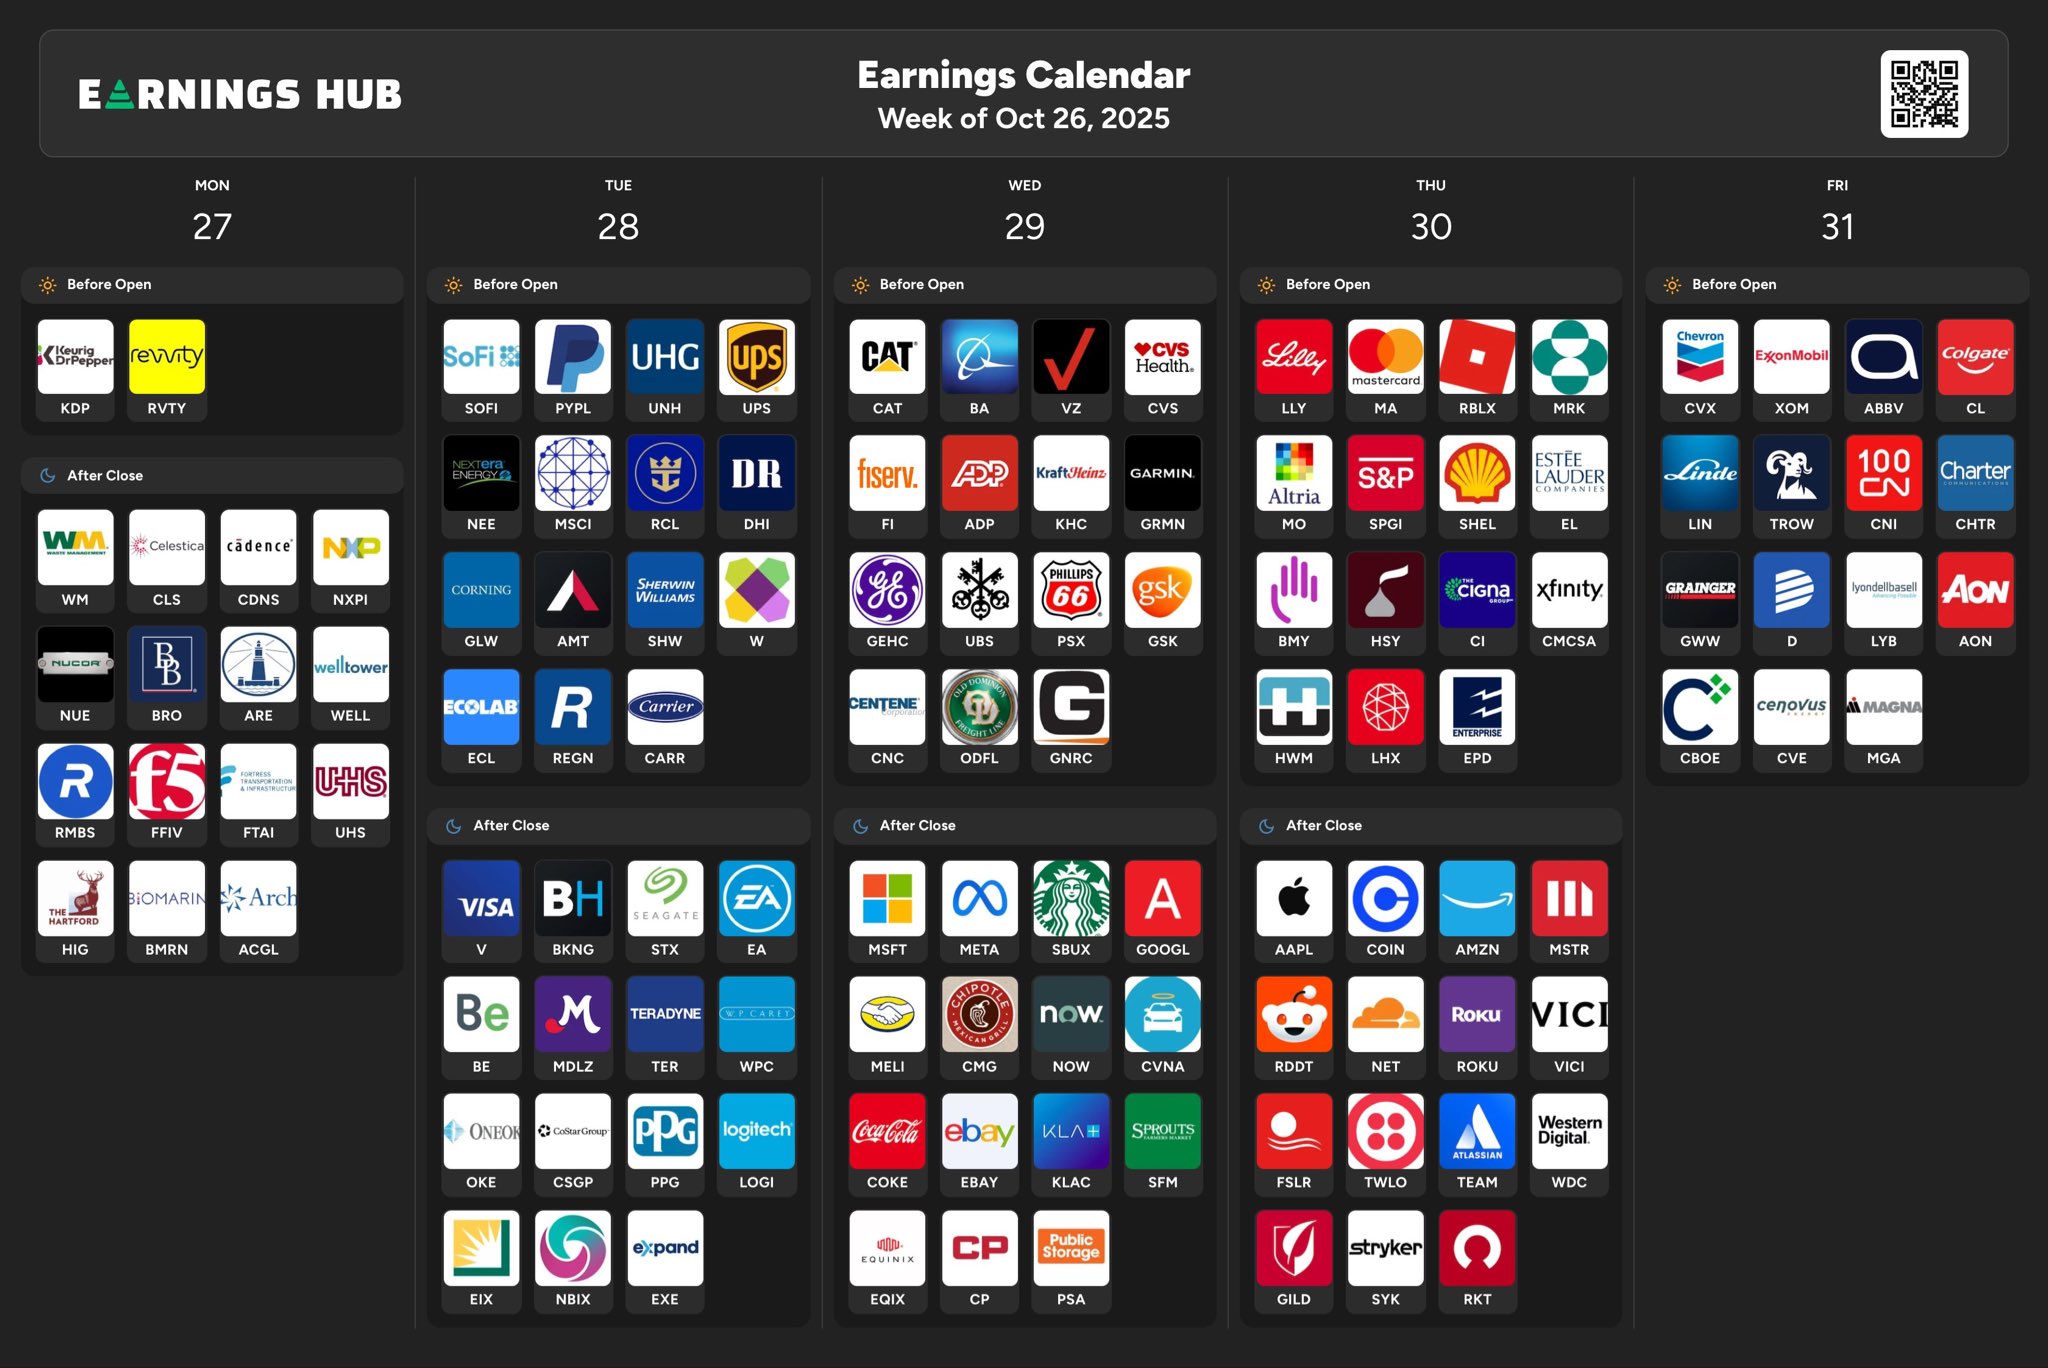
This is the Busiest Week of The Year For The Market
In just five days, we’ll get earnings results from 175+ S&P 500 companies, including five of the Magnificent Seven.
The market looks great with resolutions to the upside beginning to unfold.
I think price has already set the stage for a year-end rally, and earnings will simply be the excuse for those who don’t follow price to finally believe it.
Let’s get into it.
Breadth - "The Market of Stocks"
Breadth is something I keep an eye on every week. The "Market of Stocks" really shows the health of the underlying market. The index fails to tell the whole story when it's extremely concentrated within Tech.
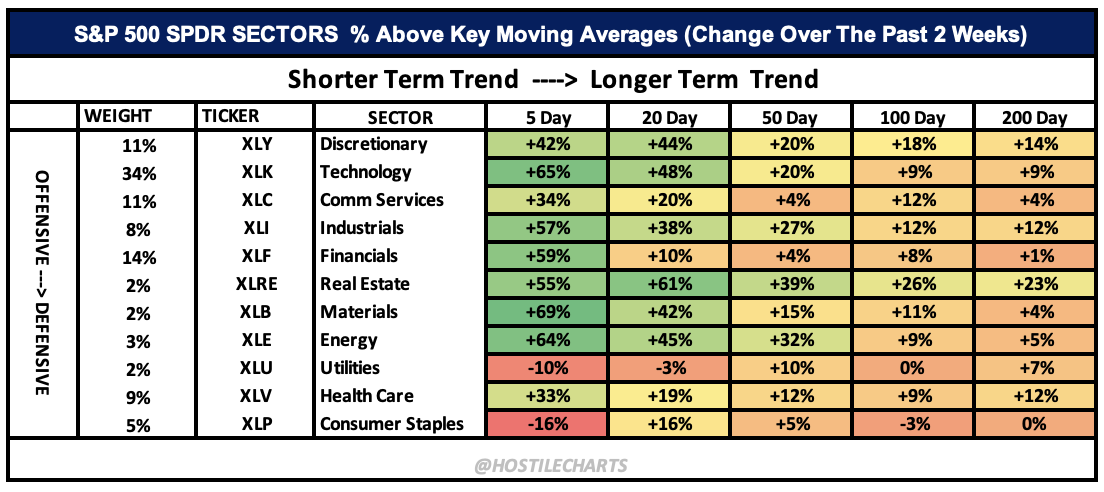
Let's Look at The Improvement Over The Past Two Weeks
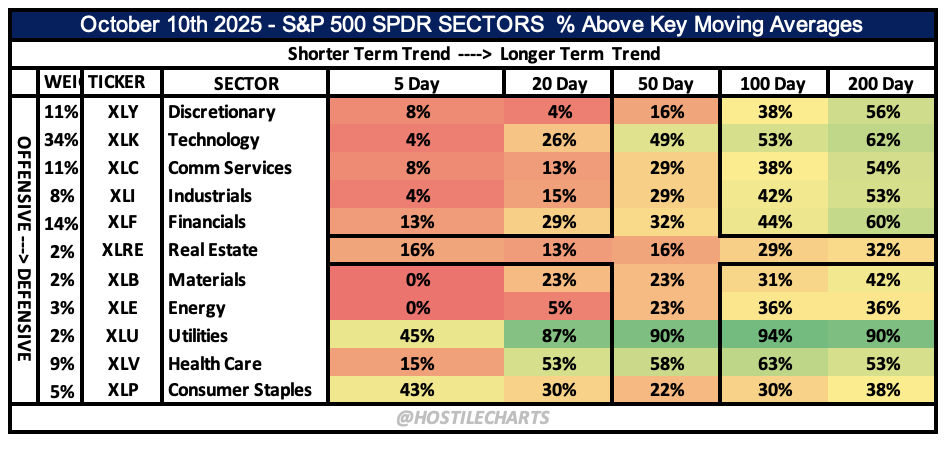
Two weeks ago, sector breadth looked washed out. On October 10th, nearly every offensive group sat deep in the red, with fewer than 20% of components above short-term moving averages. Technology was barely hanging on, and Energy had zero participation.
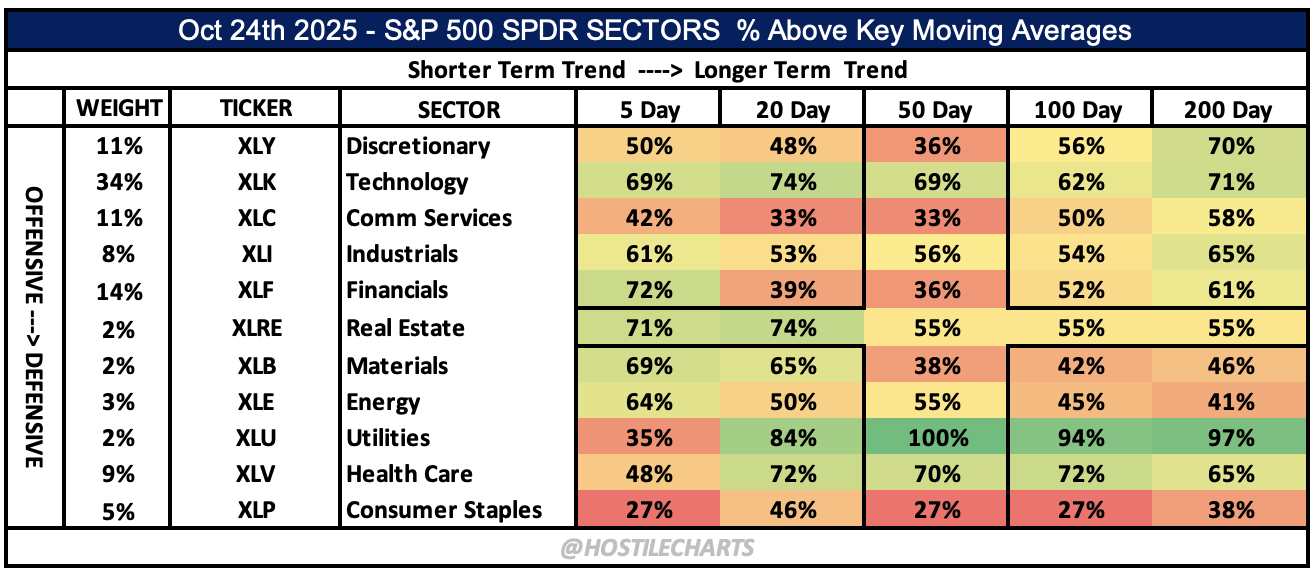
Fast forward to this week and the tone has flipped.
Short-term participation surging across the board:
Technology (XLK) jumped from 4% → 69% above the 5-day and 26% → 74% above the 20-day.
Financials (XLF) ripped from 13% → 72% above the 5-day, showing leadership rotation into cyclicals.
Industrials (XLI) and Discretionary (XLY) followed with similar rebounds, each reclaiming more than half their components above the 20-day.
Longer-term trends (100- and 200-day) are stabilizing, not yet expanding, suggesting this is a short-term thrust within a broader trend repair continues.
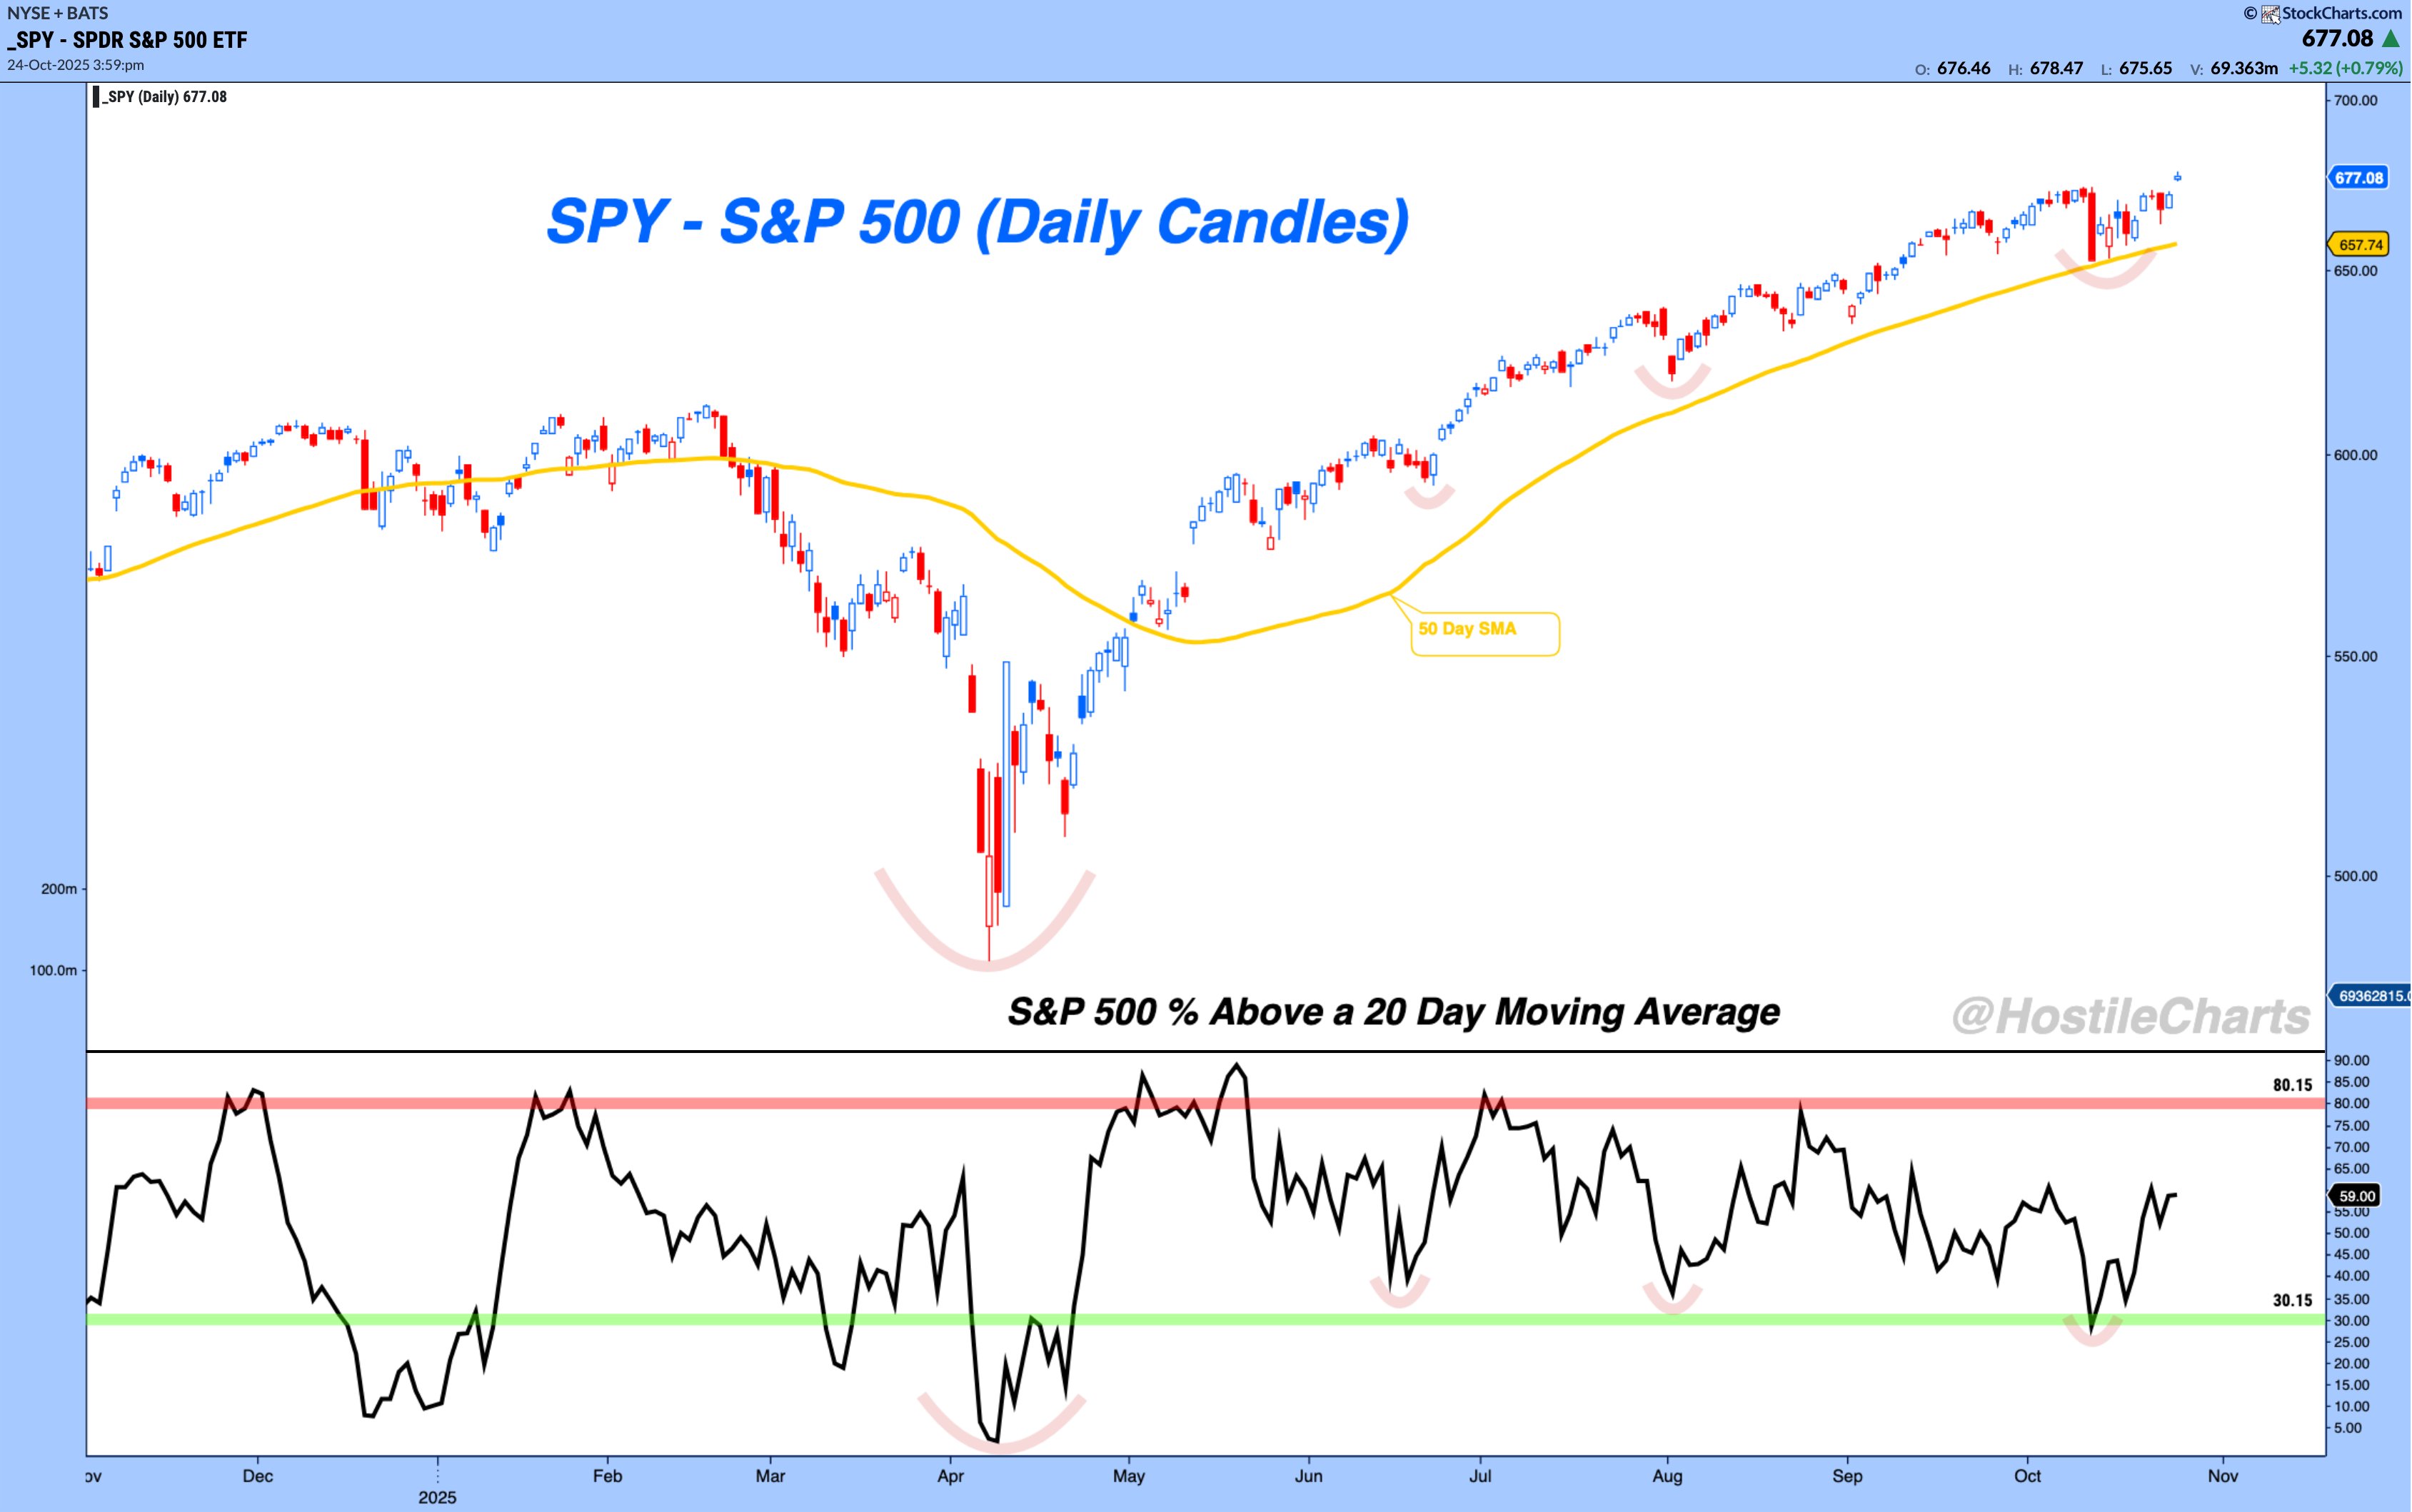
Offense is back in control, breadth is healing, and the market’s tone has clearly shifted from capitulation to confirmation.
Earnings - Get The Popcorn Ready
Earnings are always worth paying attention to. You don’t have to trade them, read every transcript, or dive into 10-Ks, but the price reactions are telling.
Chart Dump
Earnings will be the story, but price has already told it. The charts have been whispering it for weeks and the year-end rally is already here. Here are the setups and trends that gave it away.
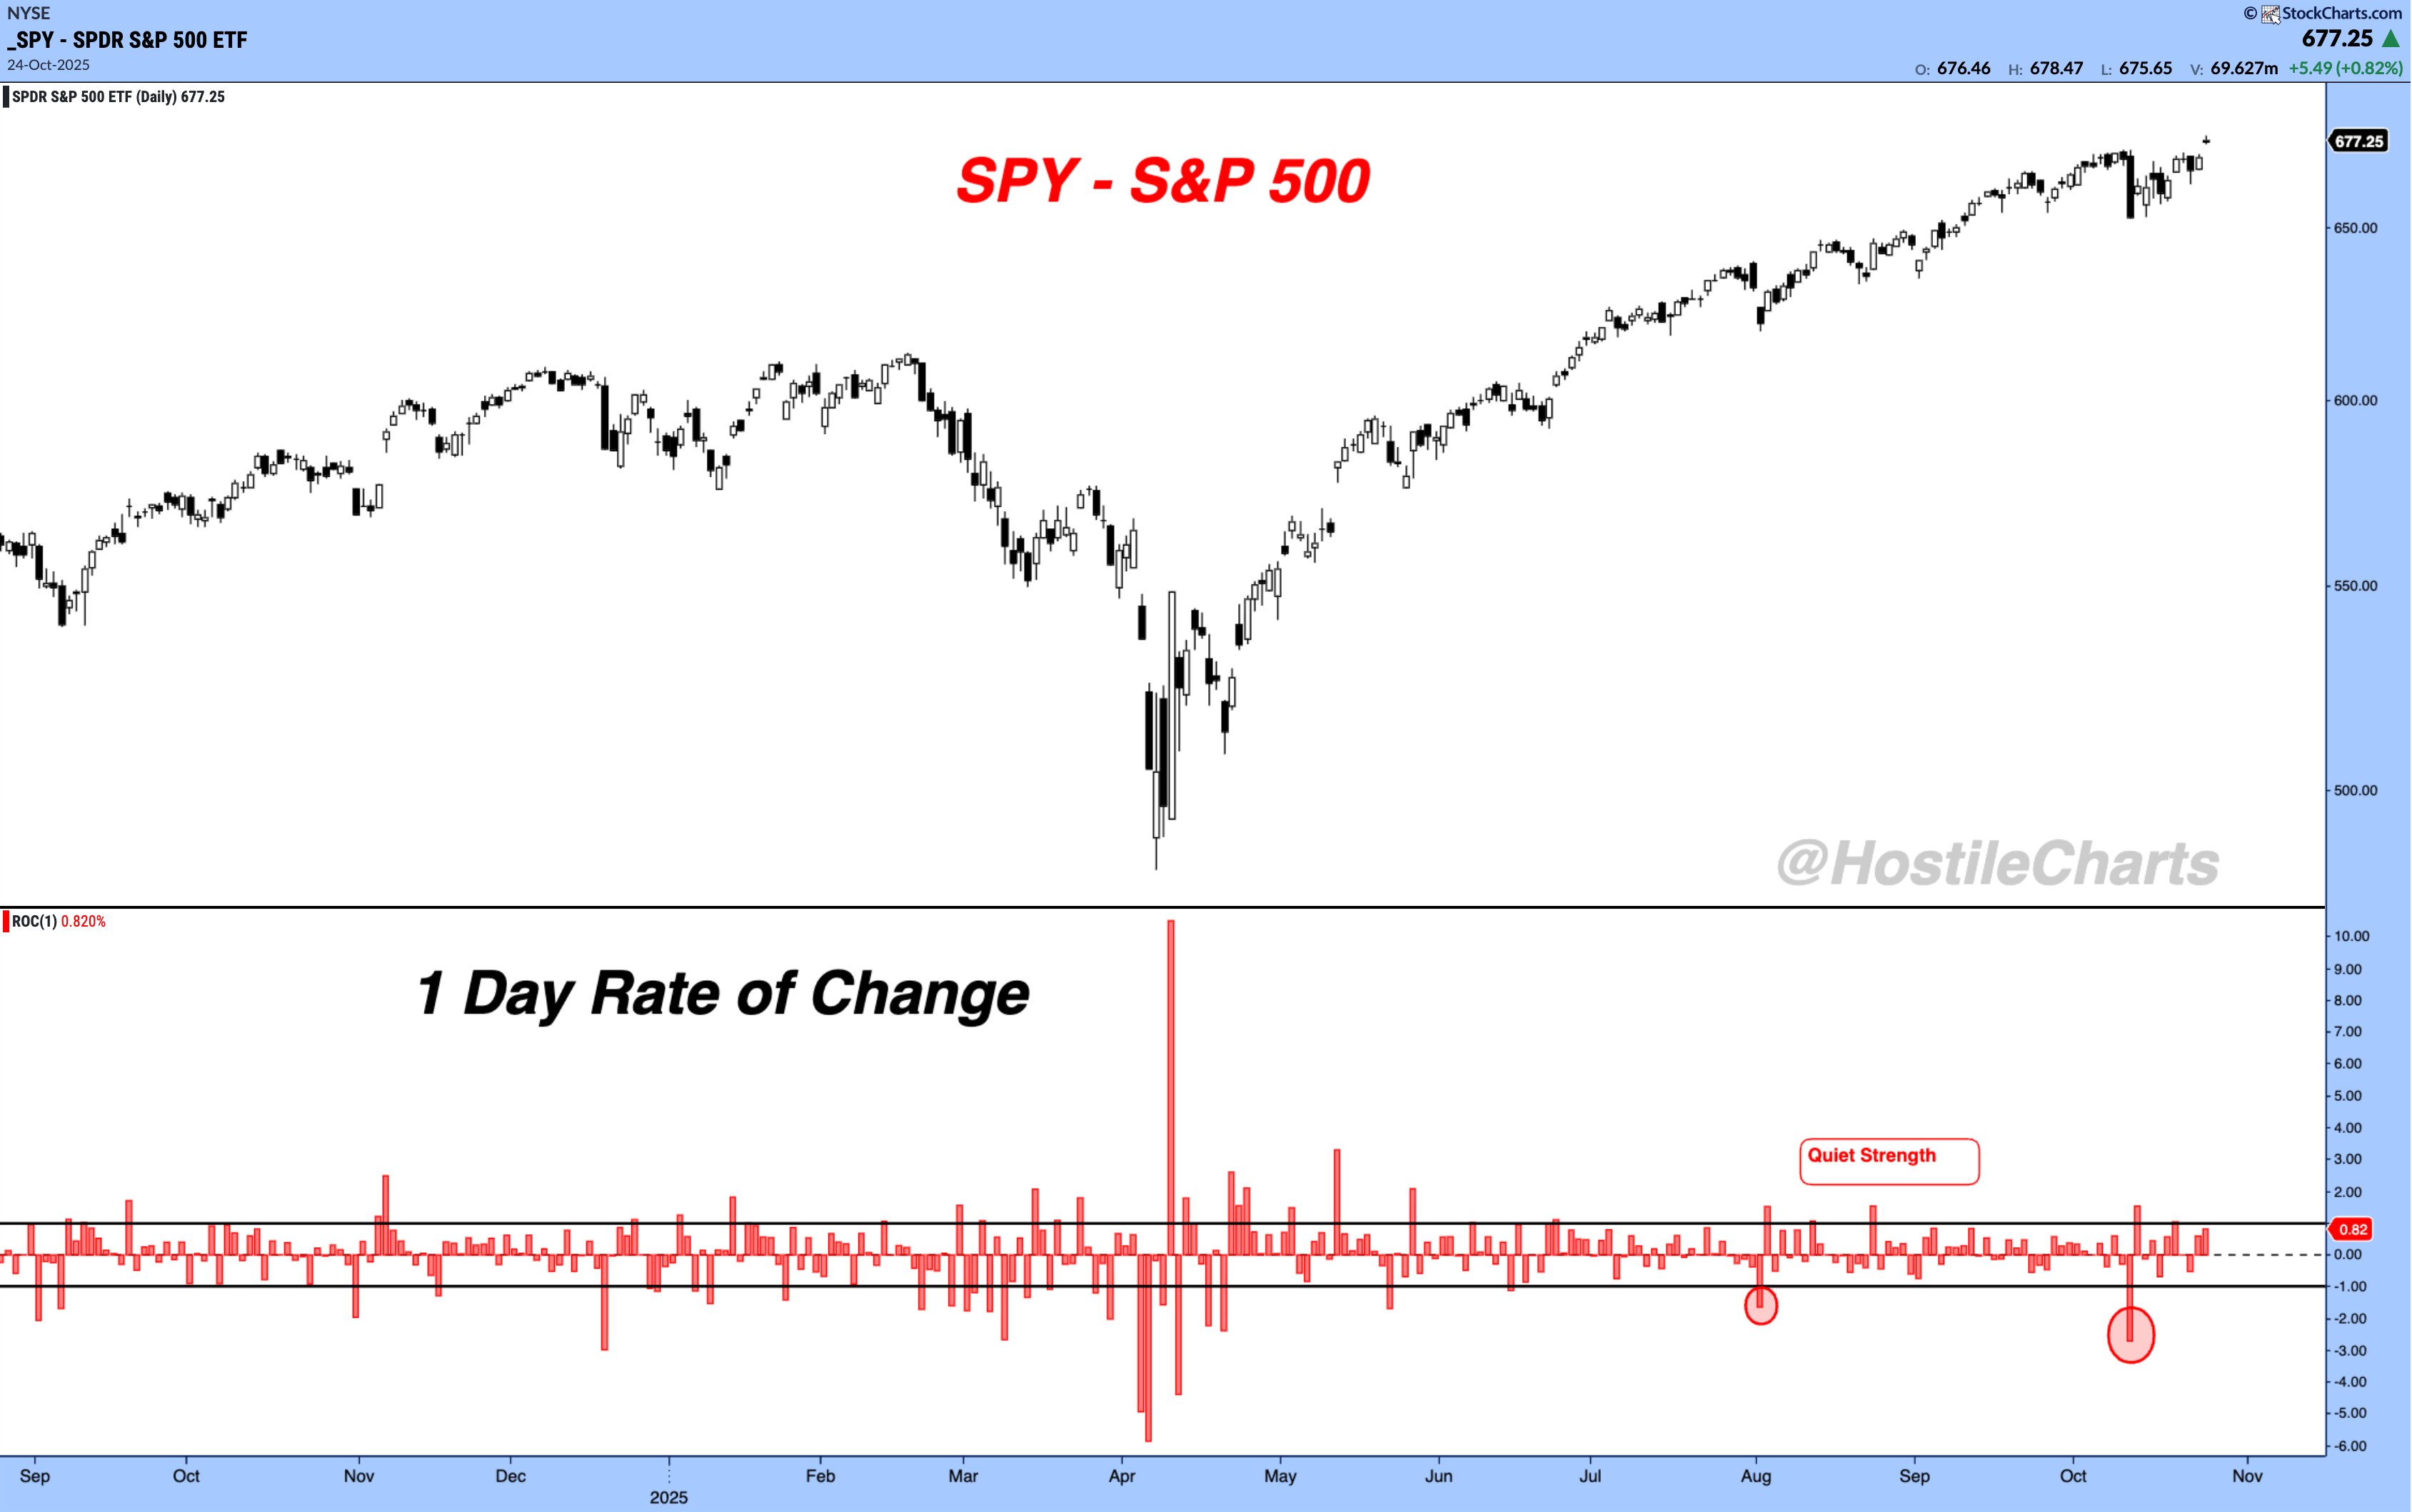
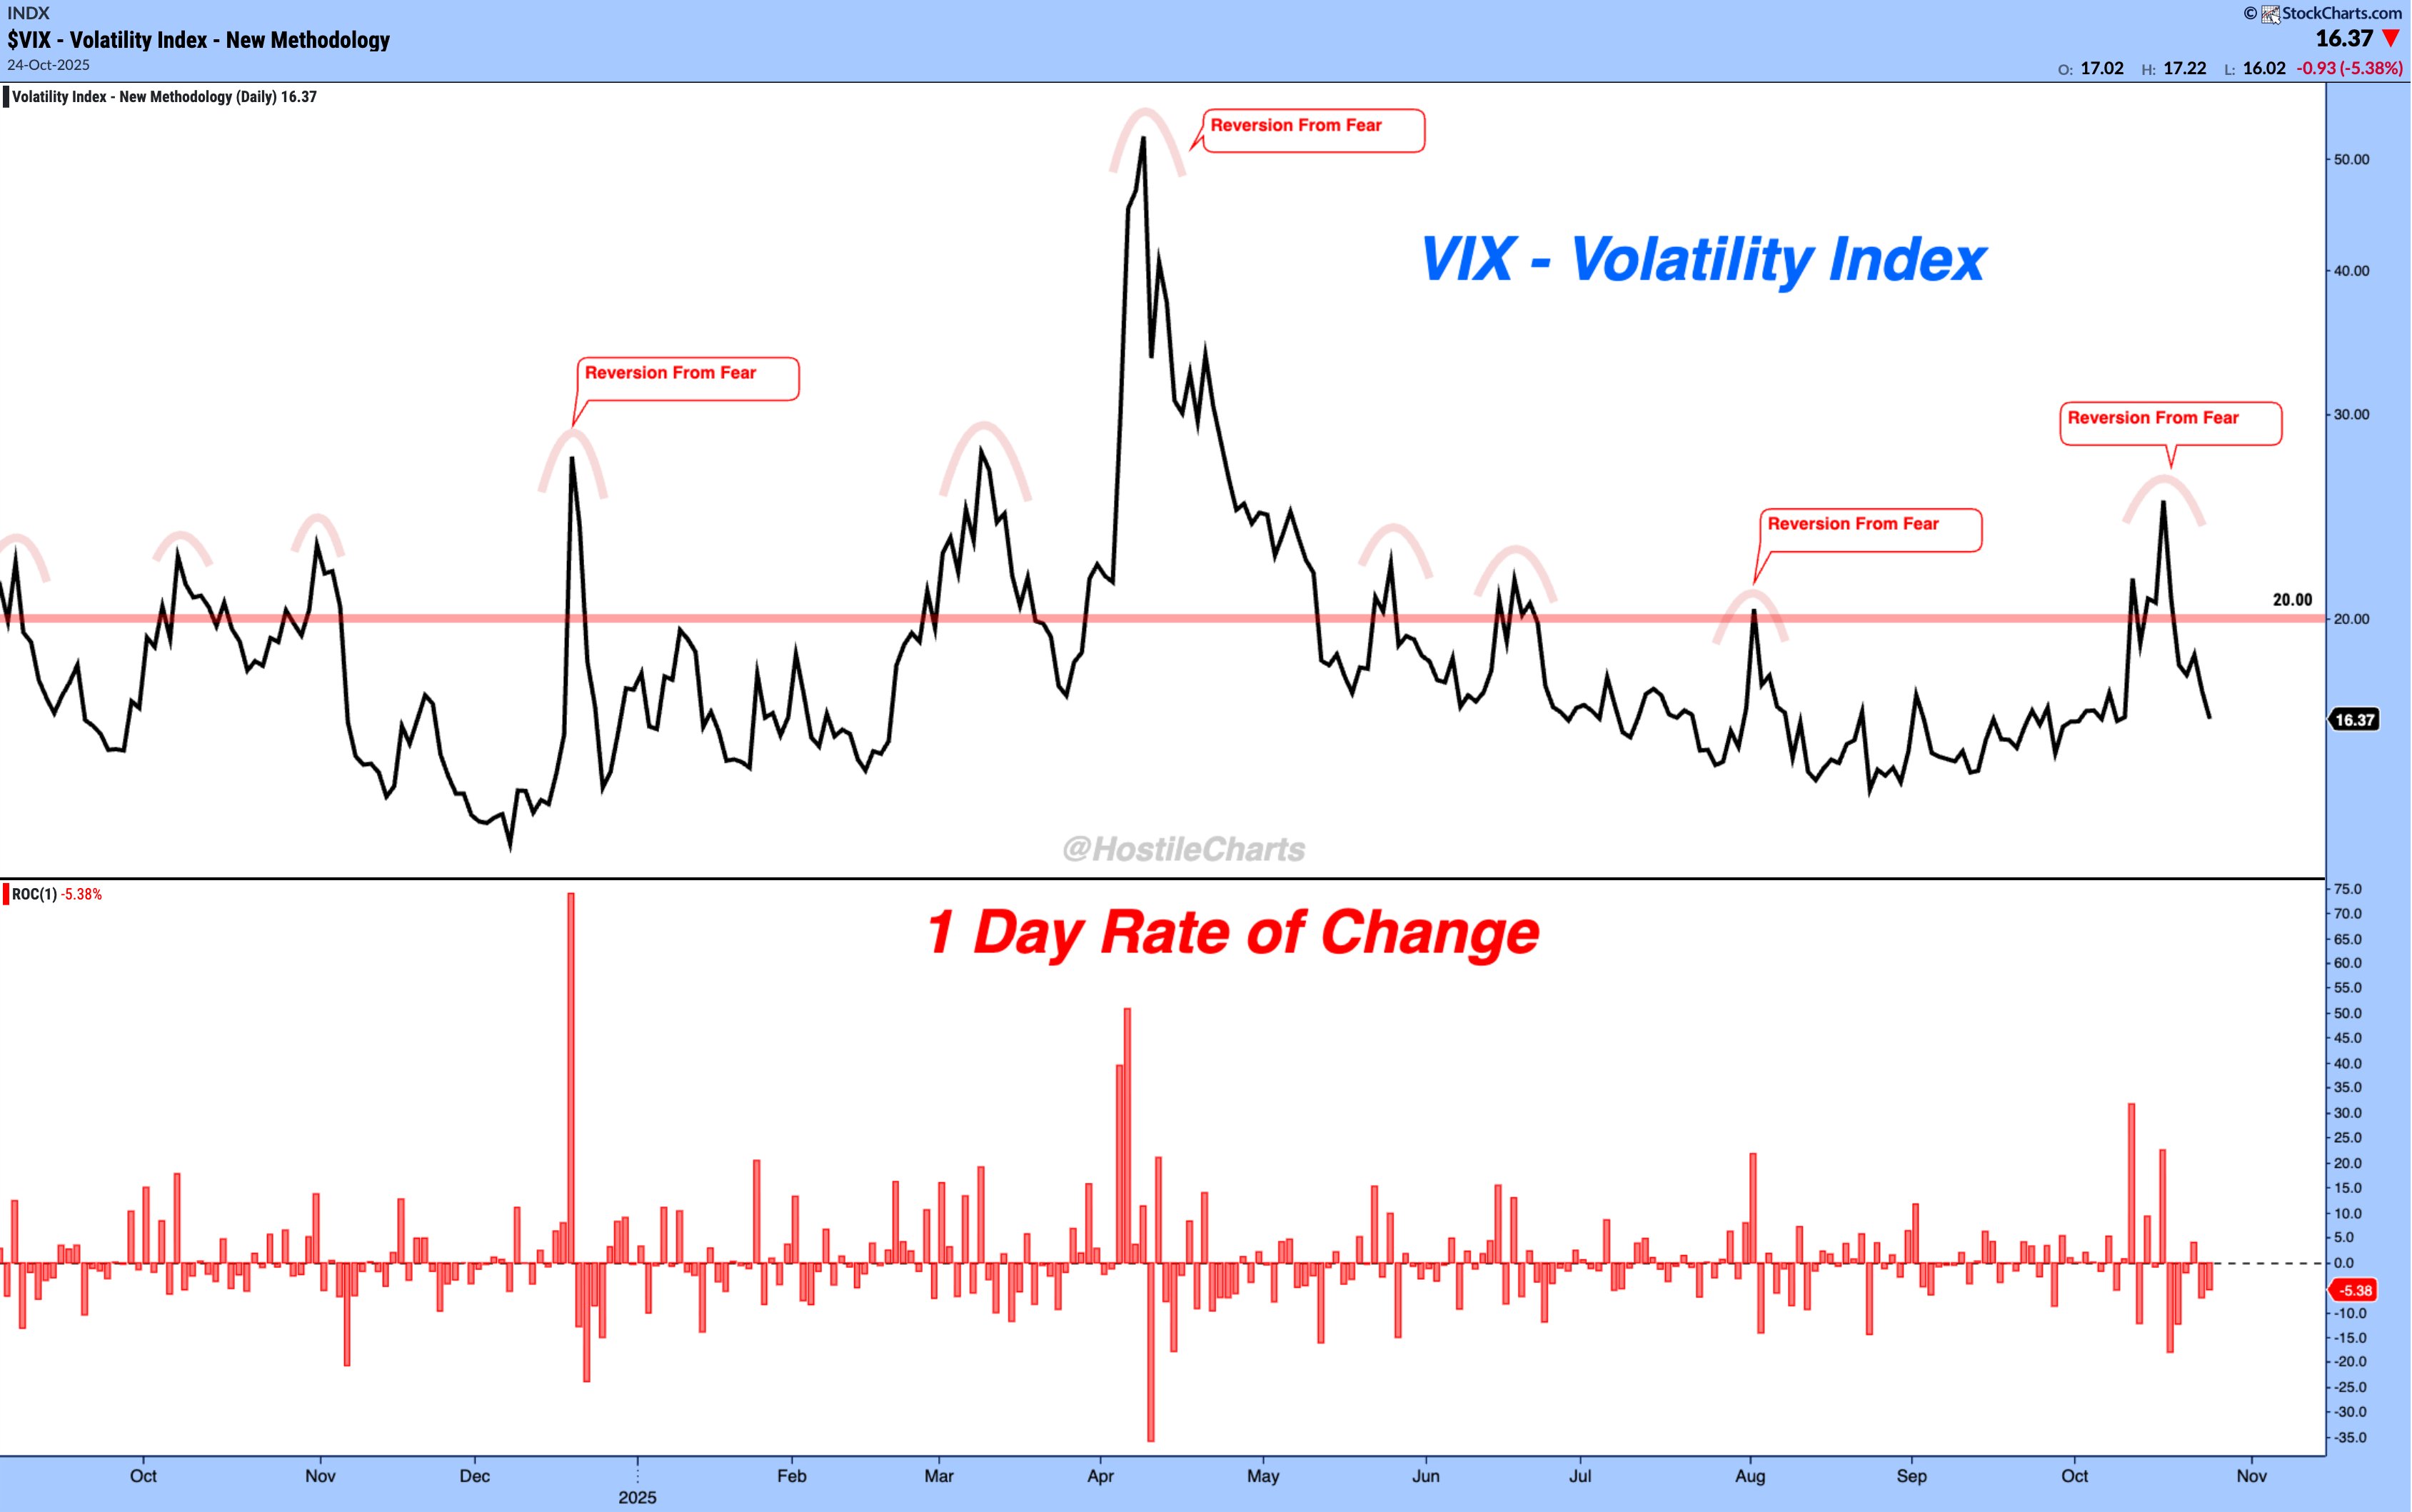
S&P 500 overlaid with 1 Day Rate of Change
A GREAT sign from the market is the lack of follow through we saw from that big down day on October 10th. Calmness is back - despite all the noise.
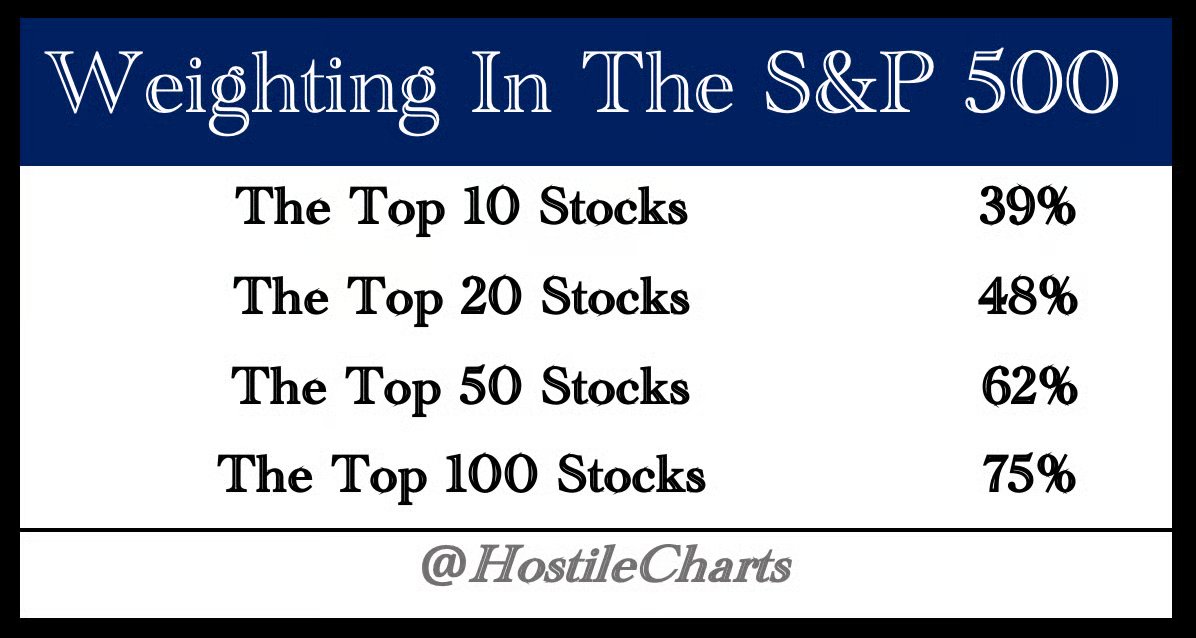
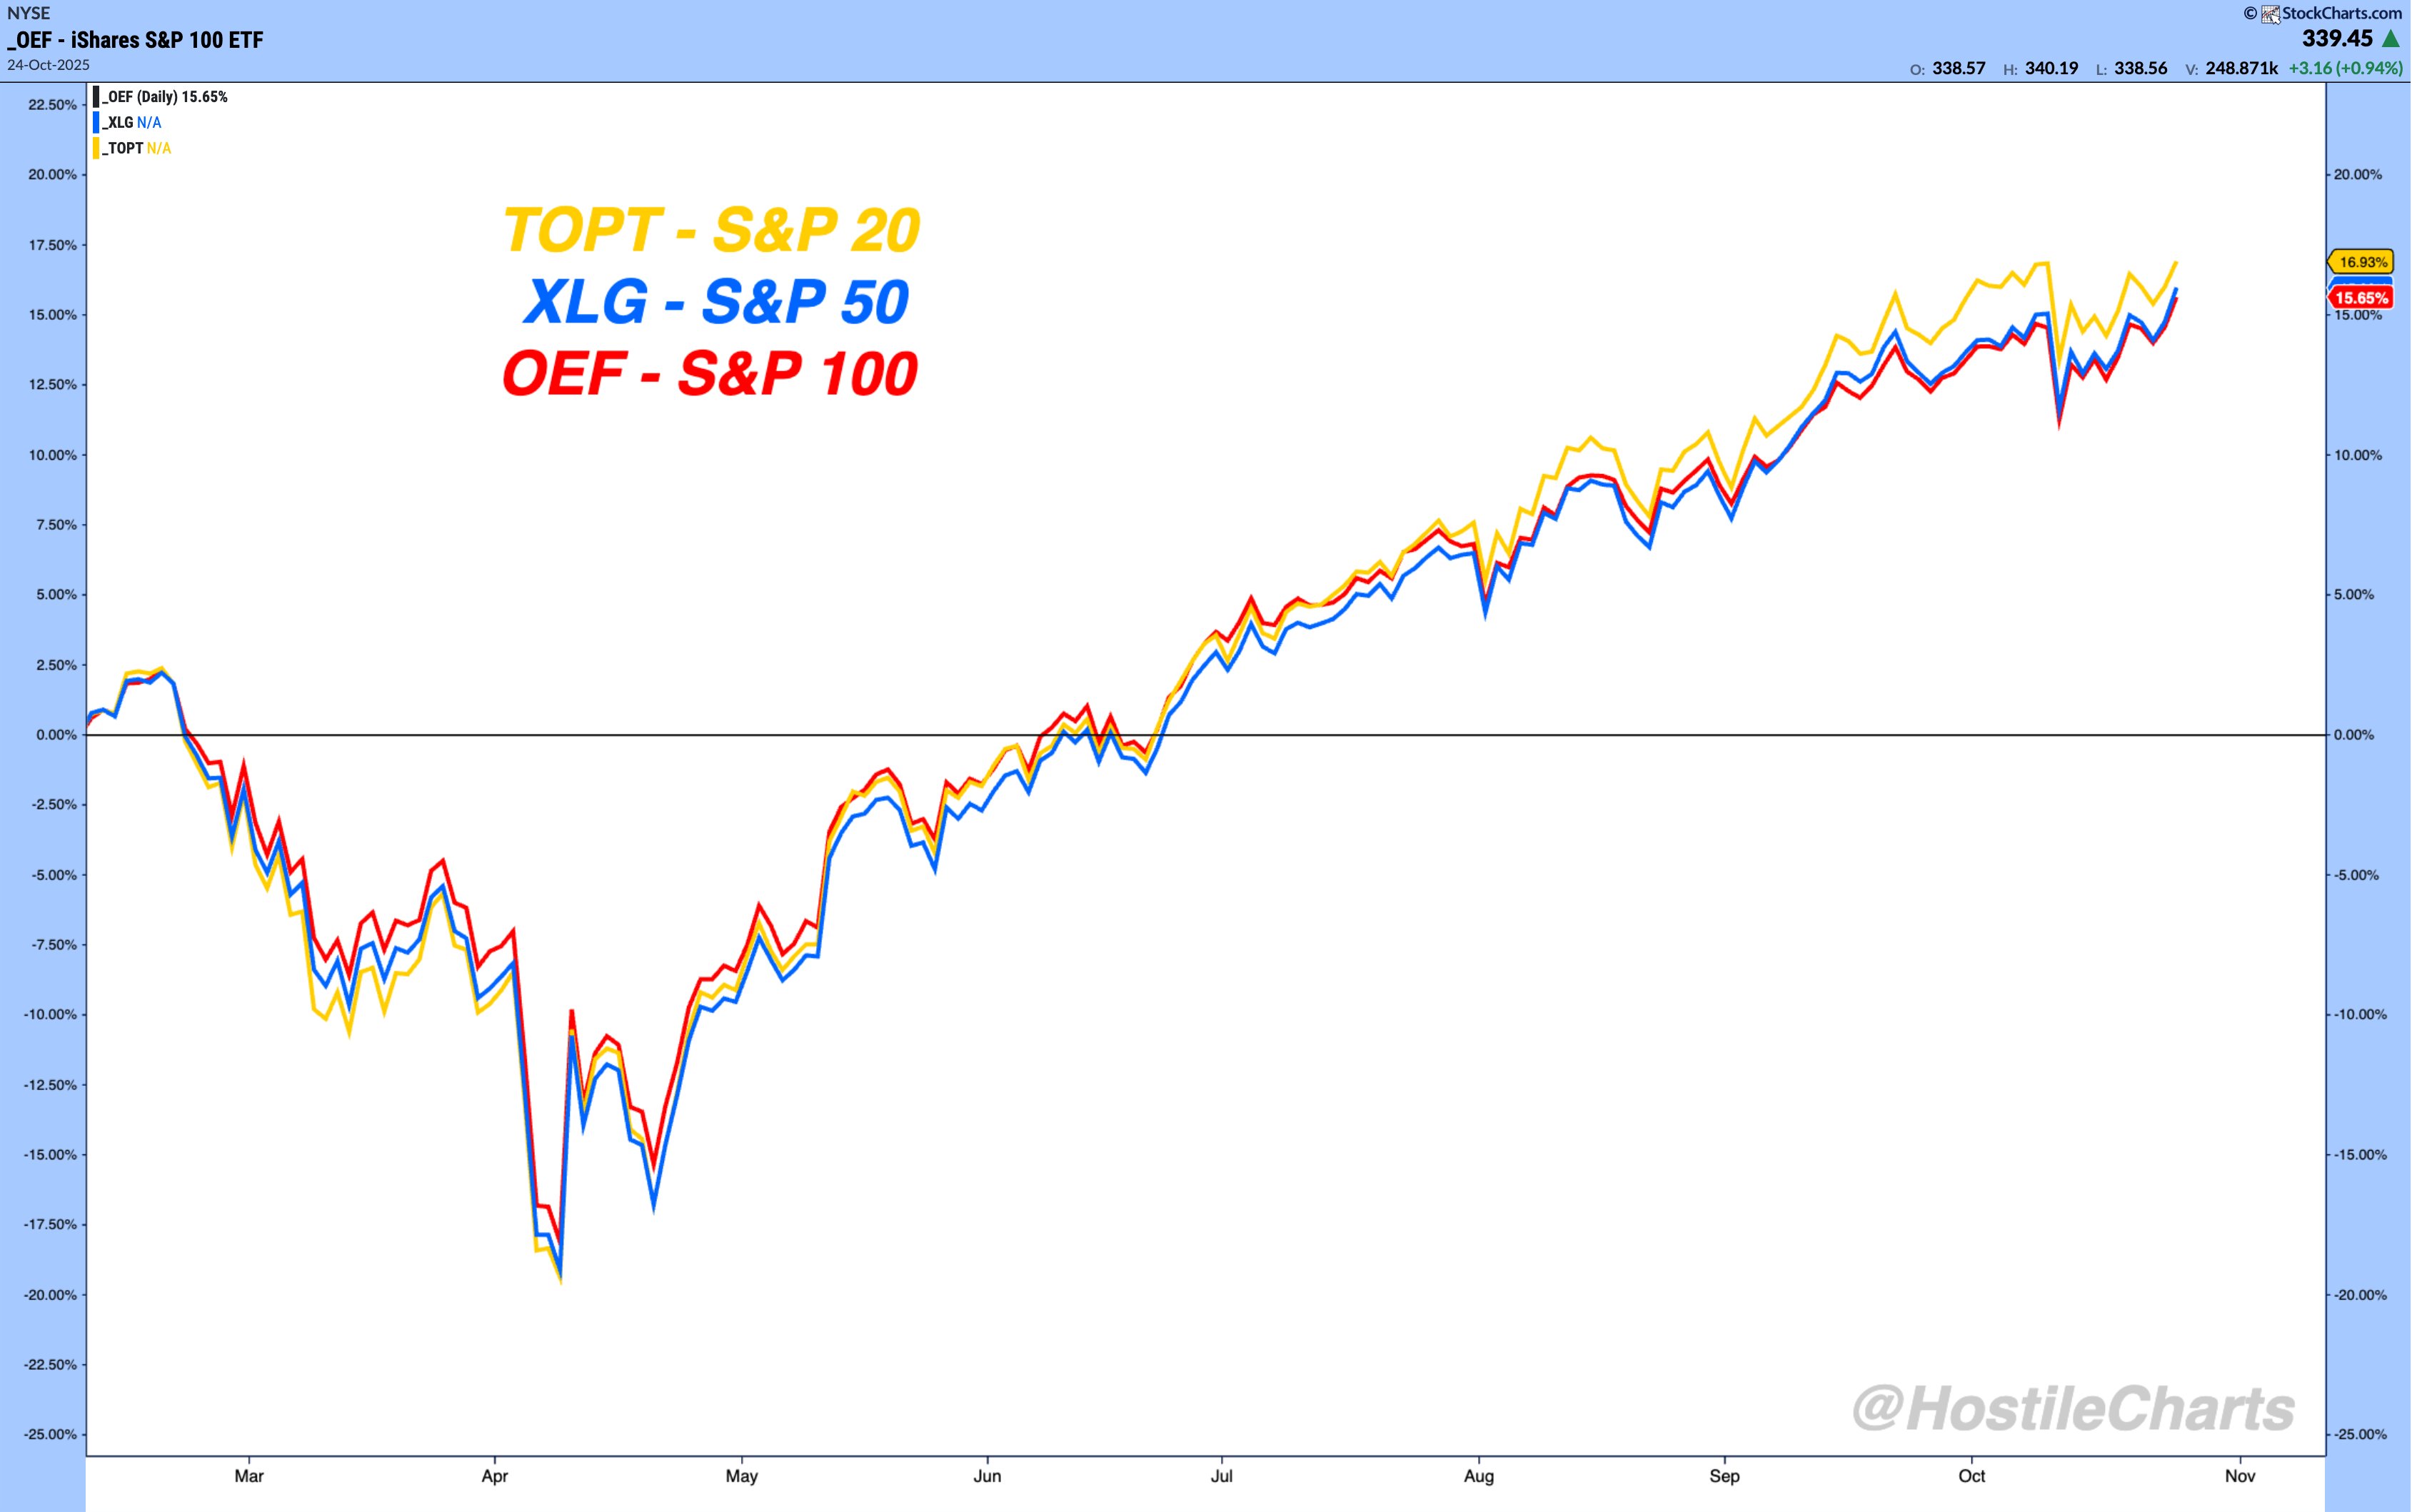
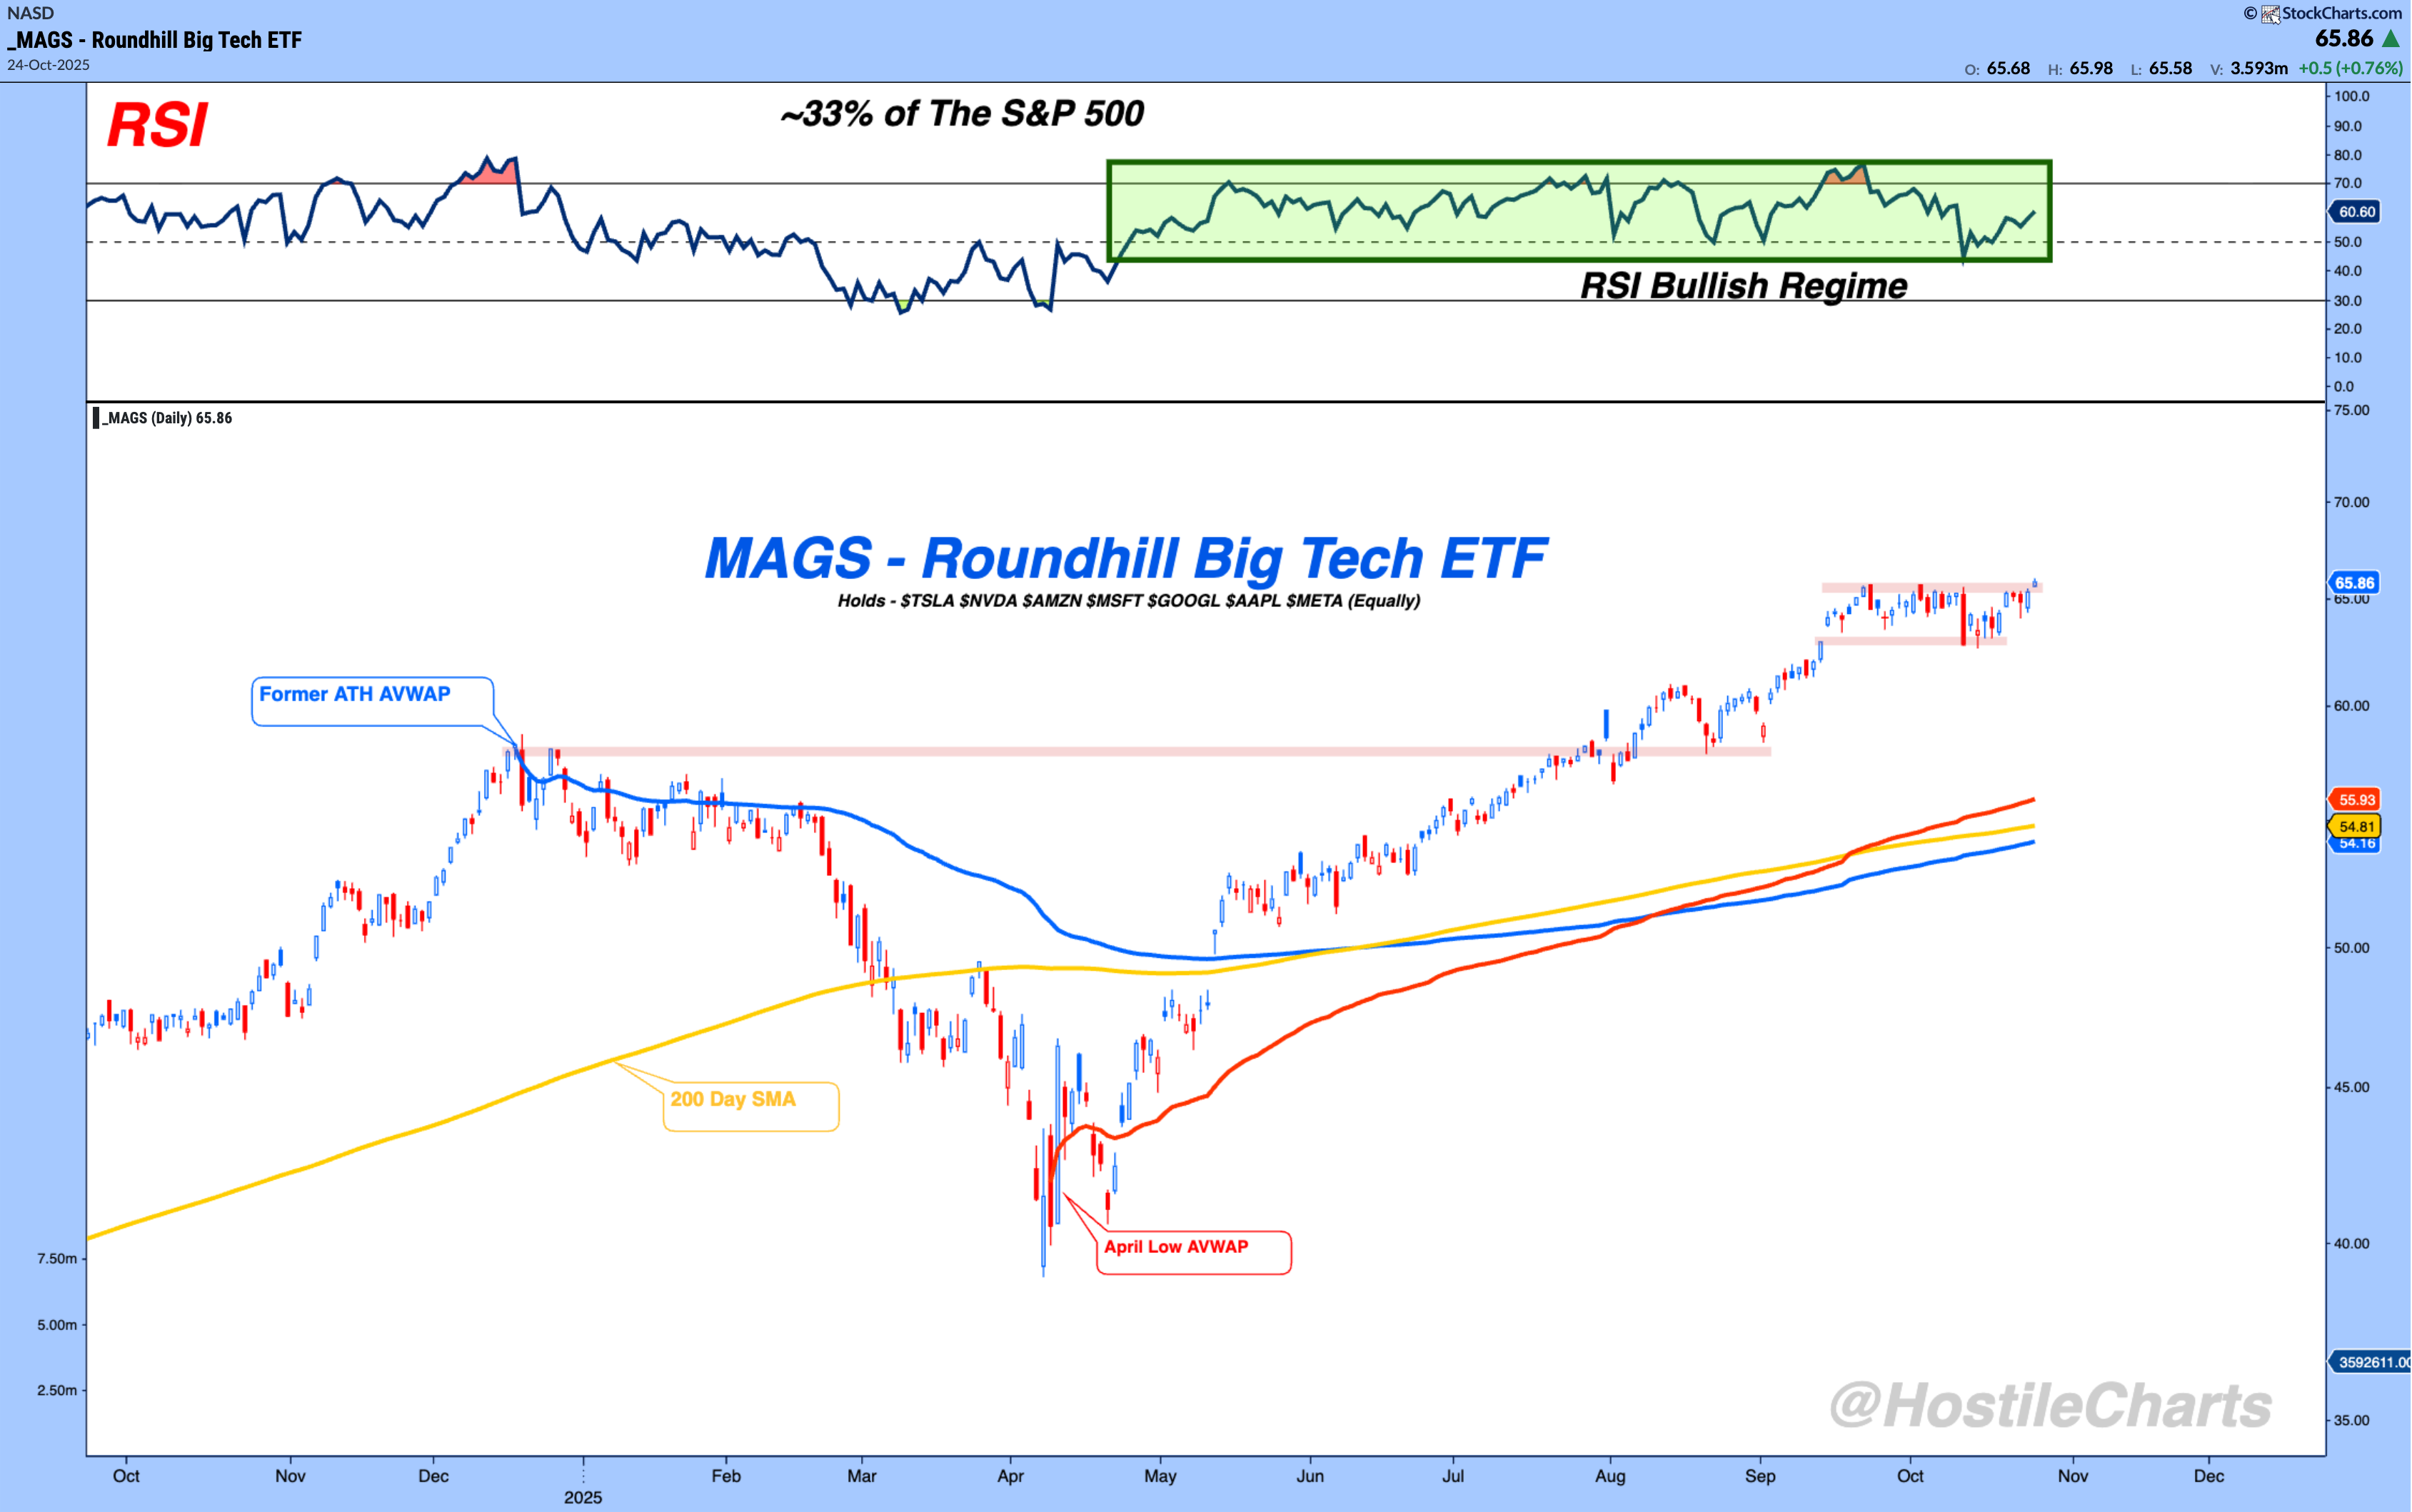
"Concentration Risk" To The Upside!
$SPY - Concentration is a risk...but not JUST to the downside.