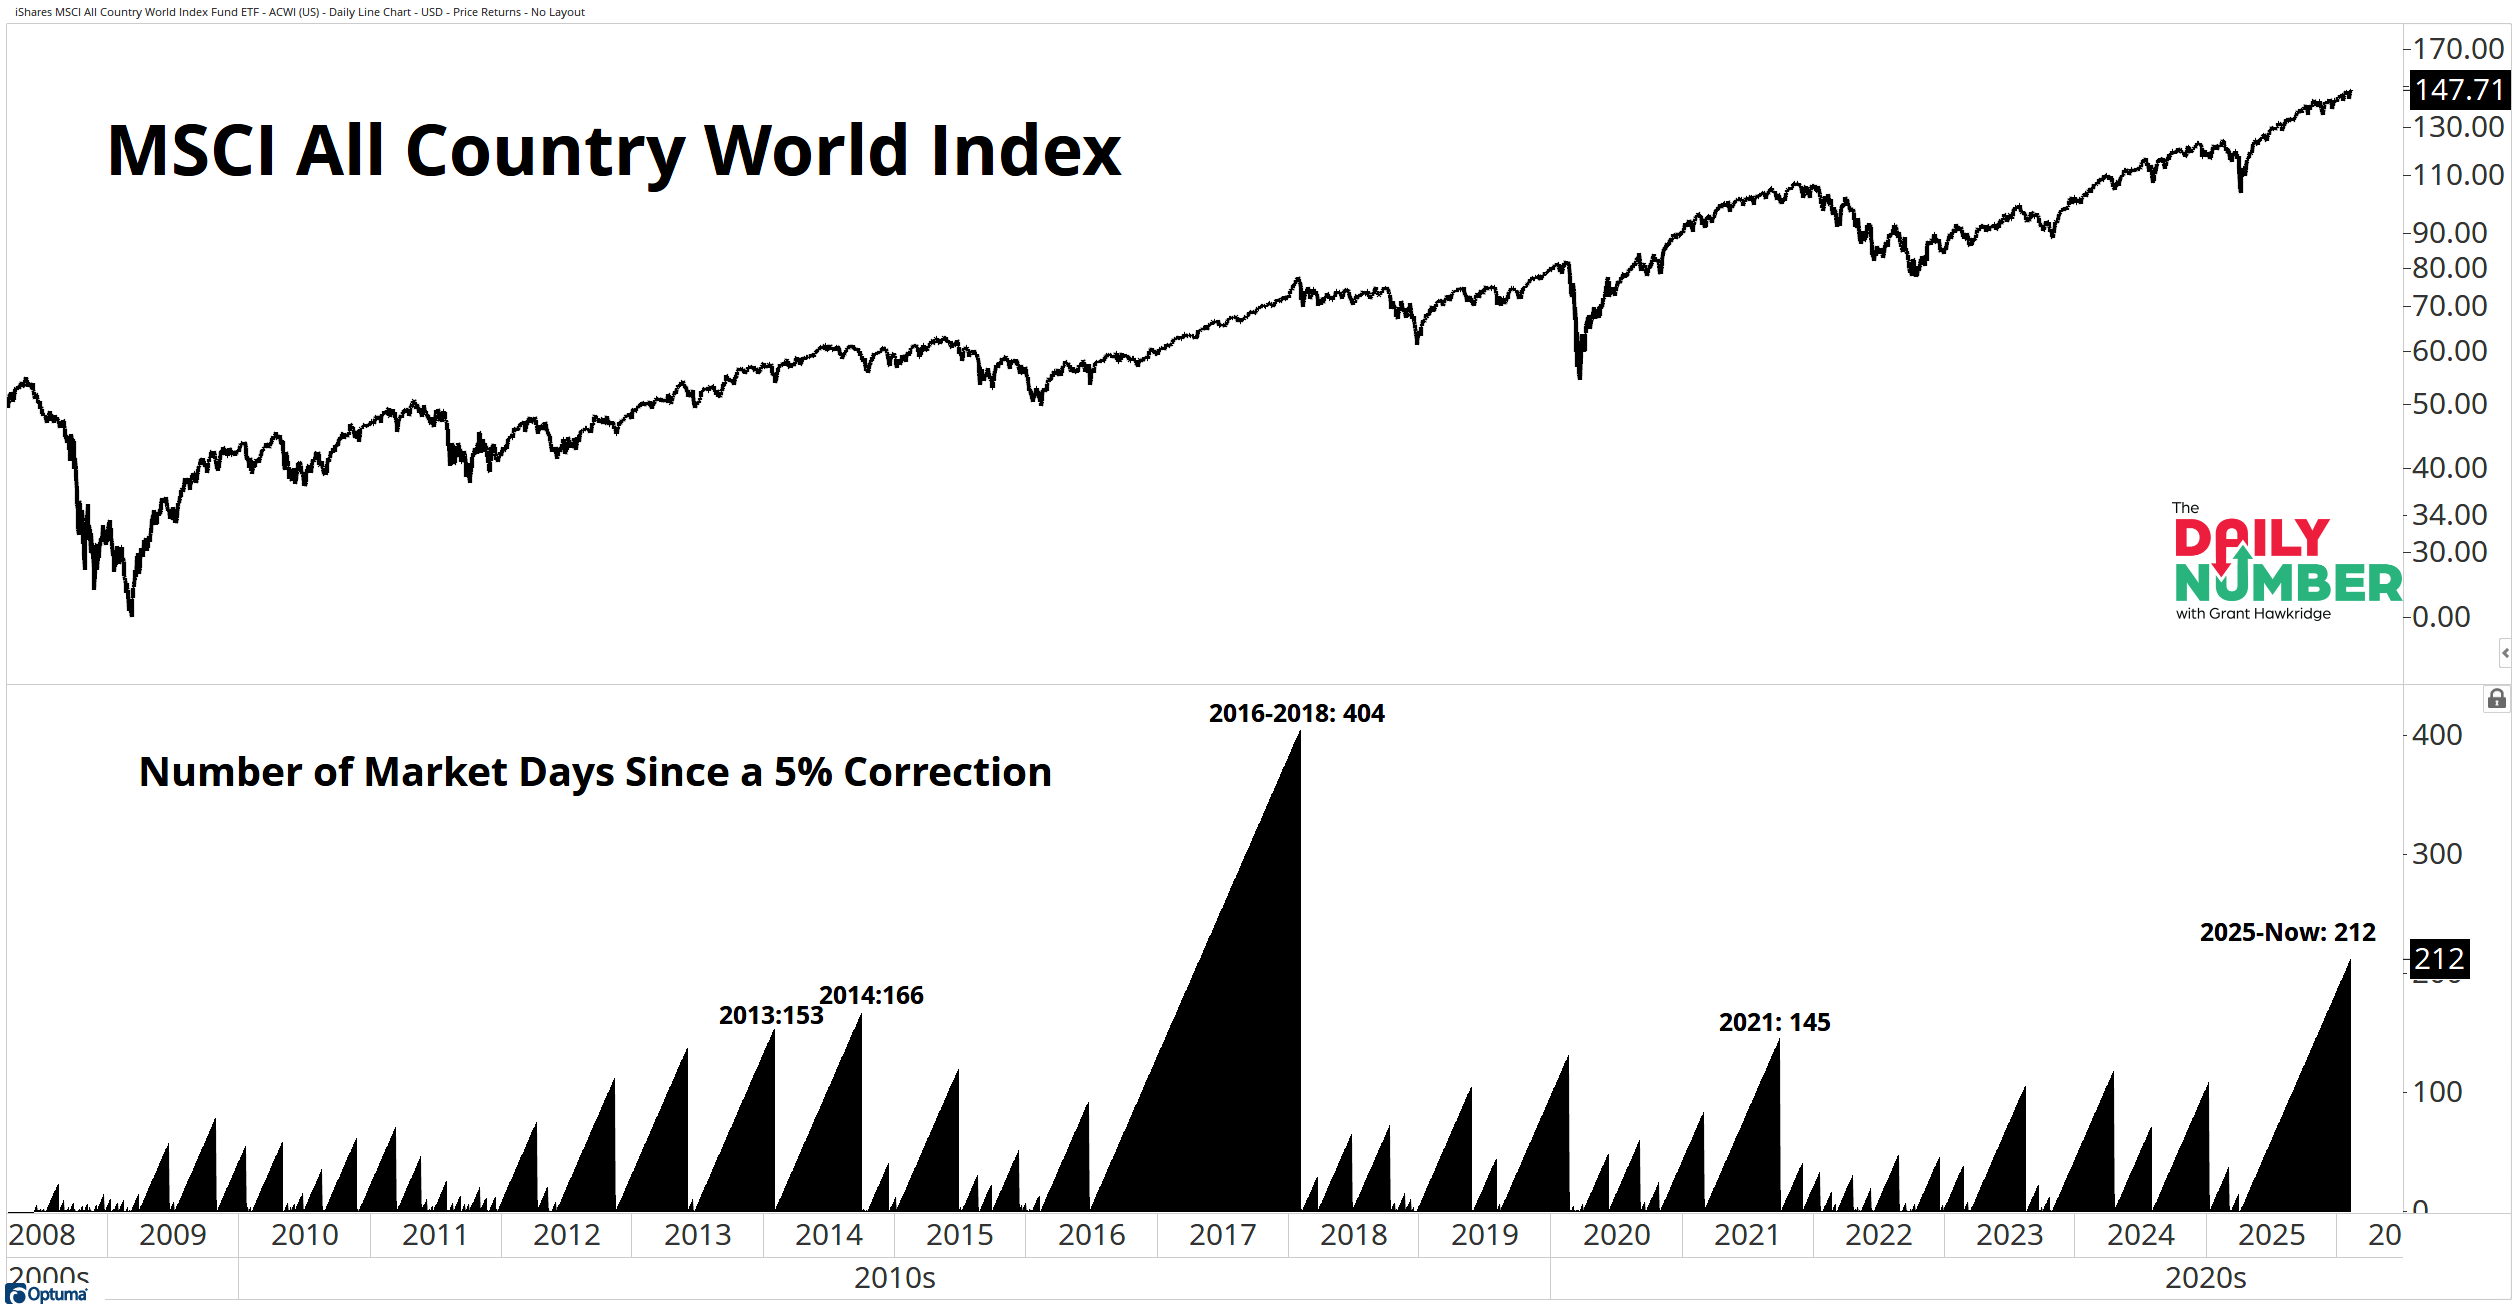
The MSCI All Country World Index has gone 212 trading days without a 5% correction.
Here’s the chart:
Let's break down what the chart shows:
The top section displays the MSCI All Country World Index in black.
The lower section displays black triangles tracking the number of trading days since the last 5% market correction.
The Takeaway: 212 trading days without a 5% correction puts this run in the top tier going back to 2008. Only the 2016-2018 stretch at 404 days lasted longer. This is the second-longest calm period in nearly 18 years.
The index keeps printing higher highs and higher lows and sits more than 9.0% above its 200-day moving average. Buyers remain in control of this trend.
RSI has held a bullish regime since May 2025. The current reading is 61.1. Momentum is elevated but not stretched, which leaves room for further upside.
Markets do not go 212 days without a 5% drop unless buyers keep showing up. Every dip gets bought within days, not weeks. Sellers try, but they cannot push the price lower. That kind of persistence only happens when demand outweighs supply.
The market has gone a long time without pain, but it has not reached the type of excess seen in prior extremes. A 5% reset will happen at some point. Until price breaks trend and momentum rolls over, the path remains higher.
If the world index will not give you a 5% reset, what does that say about global demand?
If you find my content valuable, I would greatly appreciate it if you could share it with your friends, family, and colleagues. Your help in spreading the word is invaluable in supporting our work. Thank you to all of you who share!