With the year coming to an end, I want to share what I believe is the most important chart to consider in 2025.
When it comes to the most critical stocks, it's all about tech. This has been the case for at least 15 years.
Mega-cap tech not only dominates U.S. indexes, but these stocks also play a major role in most investors' portfolios.
The same is true for semiconductors, which serve as both a benchmark for the technology sector and a barometer for the broader market. They are also the posterchild of the ongoing AI revolution.
By evaluating relative trends, we gain insight into leadership and can also assess the market's overall health.
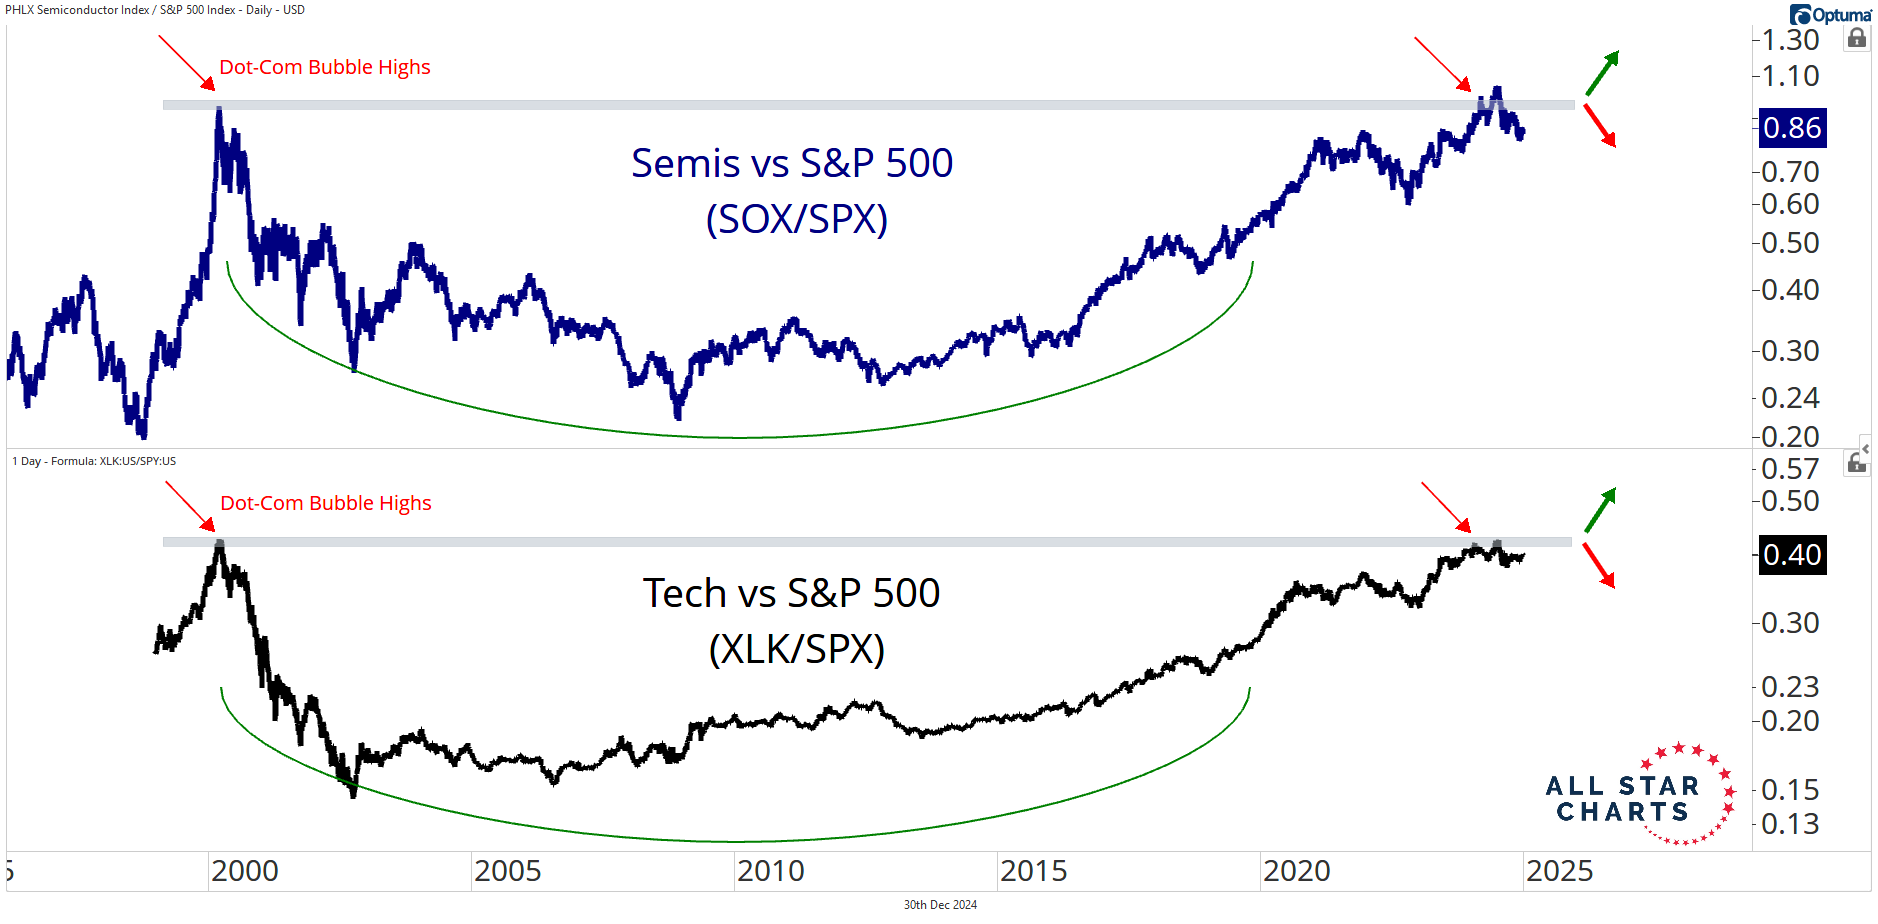
Take a look at the long-term view of Technology $XLK and Semiconductors $SOX relative to the S&P 500 $SPX.
Both ratios are sitting just below their dot-com bubble highs.
The last time we were here, technology entered a prolonged period of underperformance.
If these roll over, it would signal a shift away from tech dominance.
Under that scenario, equities are likely to experience a hard time overall.
However, if these ratios break out above their previous highs, it would indicate strong confirmation that the bull market has room to run lead by heavy tech companies.
I think a resolution will happen next year.
I don't foresee these relationships continuing sideways for much longer. That’s already been the case for most of the last year.