From the Desk of Steve Strazza @Sstrazza and Alfonso Depablos @AlfCharts
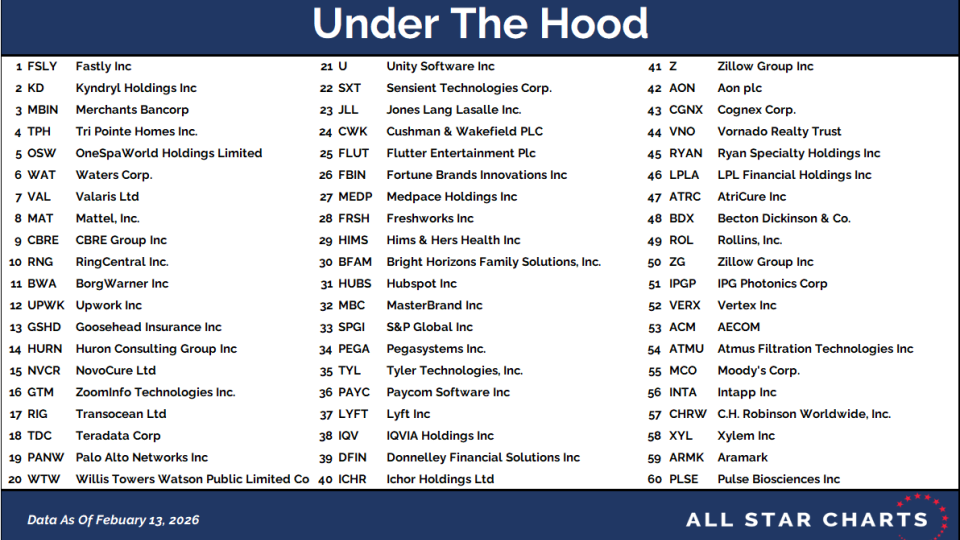
We love our bottoms-up scans here at All Star Charts. We tend to get really creative when making new universes as we want to be sure they will deliver us the best...
With the stock market trading sideways for the past two months, we’re still finding pockets of strength and individual names that offer favorable risk-reward opportunities.