The first thing we want to do when analyzing any asset, crypto or otherwise, is identify the direction of the primary trend. In the case of Bitcoin, the trend for the lifetime of this asset is clearly: Up.
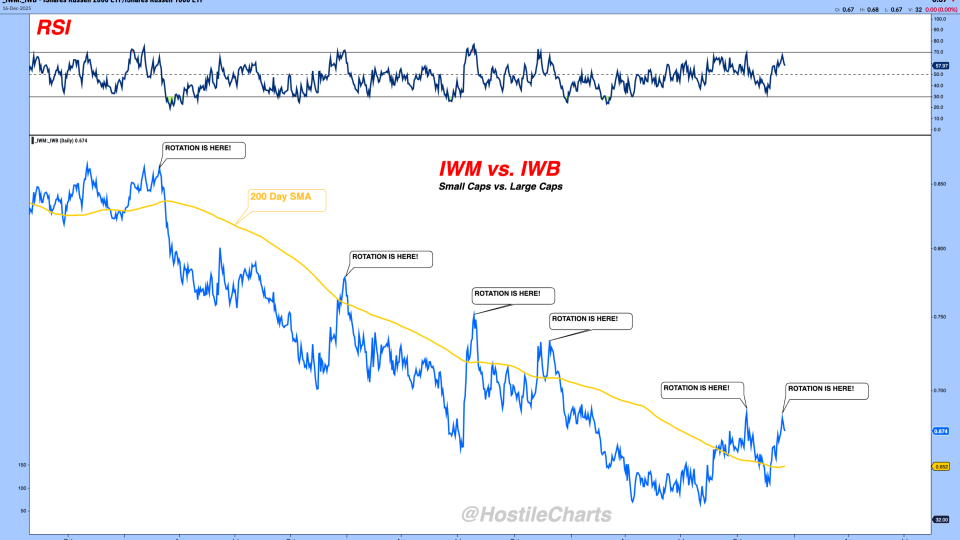
We’ve written extensively about the split market we’ve been in for the better part of the year, as the same leaders coming into the Q1 crash emerged as the strongest areas coming out of it....
From the desks of Steve Strazza @Sstrazza and Tom Bruni @BruniCharting
In this post, we're going to share 10 of the most important charts we're looking at right now. Some are merely for observational purposes or to highlight some of...
In a recent post on Chinese Internet stocks, the team laid out the bullish case for why many of these names look set up to run. Since publishing this post, many of the names...
There are no called strikes on Wall Street. In other words, we're not penalized for not swinging, like you are in baseball. We have the ability to be patient, to a certain extent at least, depending on your mandate. But most of us don't have mandates...
For those new to the exercise, we take a chart of interest and remove the x/y-axes and any other labels that would help identify it. The chart can be any security in...
Hard to believe some low volatility setups are appearing all over the place, but that is the market we are in. The "bull market" in stocks continues higher, seemingly unabated. Who am I to fight it?
From a Precious Metals' perspective, Palladium has been a clear leader for over a decade. Despite its strong long-term performance, a sharp March drawdown has people wondering whether this is...