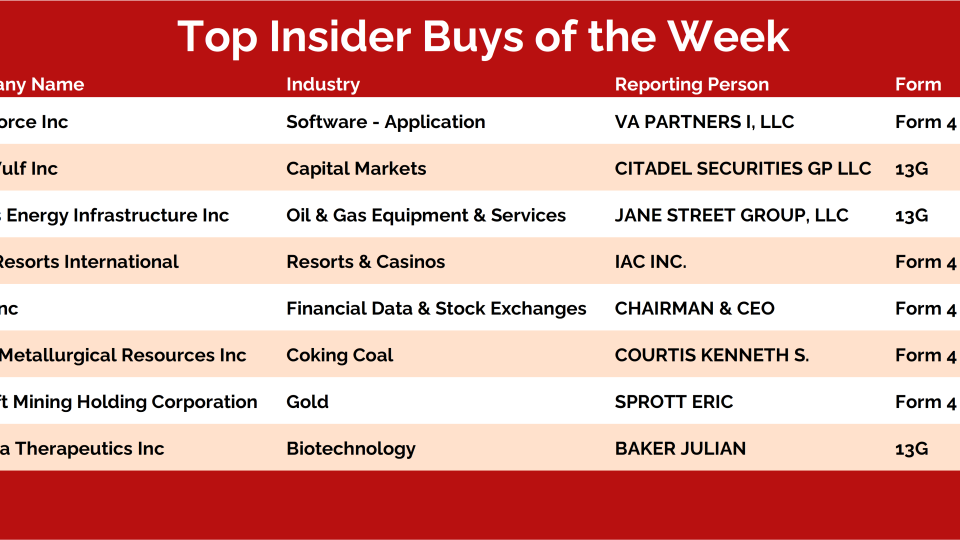
Looking for signs of strength, not just absence of weakness.
Burden of proof is on the bulls to show that strength can persist.
At this point, we cannot know whether the current environment will ultimately end up bearing more than a passing resemblance to the 2008/09 financial crisis. There are, however, enough similarities between now and then that the comparison is worth considering.
Consider what we are seeing from a price perspective and across a handful of other indicators:
Price: Failed rallies have been followed by lower lows on the S&P 500 since the index peaked in January of this year. A similar pattern developed following the market peak in October 2007. The damage done to a 60-40 passive portfolio has been greater this year than at a similar post-peak point during the financial crisis, but it’s perhaps not a coincidence that prior to this year, the only time in the past quarter century that both stocks and bonds were underwater in back-to-back quarters was...
Welcome back to our latest Under the Hood column, where we'll cover all the action for the week ended June 24, 2022. This report is published bi-weekly and rotated with our Minor Leaguers column.
What we do here is analyze the most popular stocks during the week and find opportunities to either join in and ride these momentum names higher, or fade the crowd and bet against them.
We use a variety of sources to generate the list of most popular names.
There are so many new data sources available that all we need to do is organize and curate them in a way that shows us exactly what we want: a list of stocks that are seeing an unusual increase in investor interest.
In this weekly note, we highlight 10 of the most important charts or themes we're currently seeing in asset classes around the world.
Risk Assets Holding on by a Thread
Risk assets have been under consistent selling pressure for some time now. The Russell 2000 and Bitcoin are both excellent examples of the damage that’s already taken place. Both are holding on by a thread at crucial support levels. As you can see in the chart, for Bitcoin, the 2017 highs around $20,000 are the level we're watching. For small-cap stocks, the line in the sand is at the 2018 and 2020 highs around 171.
If the Russell 2000 and Bitcoin continue to hold these key levels, things are likely improving for stocks and cryptos more broadly. However, if they violate their respective support levels, we have to anticipate increased volatility and another leg lower for risk assets.
Check out this week's Momentum Report, our weekly summation of all the major indexes at a Macro, International, Sector, and Industry Group level.
By analyzing the short-term data in these reports, we get a more tactical view of the current state of markets. This information then helps us put near-term developments into the big picture context and provides insights regarding the structural trends at play.
Let's jump right into it with some of the major takeaways from this week's report:
* ASC Plus Members can access the Momentum Report by clicking the link at the bottom of this post.
Macro Universe:
This week, our macro universe rebounded as 74% of our list closed higher with a median return of 1.65%.
Russell 1000 Growth $IWF was the winner, closing with an 8.15% gain.
The biggest loser was the Volatility Index $VIX, with a weekly loss of -12.53%.
There was a 2% drop in the percentage of assets on our list within 5% of their 52-week highs – currently at 2%.
I'll cut right to the chase: JC put out a piece this morning highlighting the relative outperformance of the Healthcare space.
The XLV sector ETF for the space has more or less been consolidating sideways as the broader markets sold off, and one of the bellwethers here is already making new all-time highs. Feels like we'll start to see more candidates here begin to participate as well.
Last week's letter addressed the asymmetric opportunity being presented to long-term crypto investors.
By most measures, the crypto capital markets are in extreme oversold conditions. Using on-chain data, we demonstrated how Bitcoin market participants are closely approaching their maximum pain thresholds.
For long-term holders, periods such as these represent advantageous places to more aggressively average into spot positions.
Over this time frame, we strongly believe that we'll look upon this period as a great time to have accumulated Bitcoin and other major cryptocurrencies.
But this raises yet another question: What does the short-term outlook look like?
As any technical analyst would be quick to announce, long-duration assets and cryptocurrencies have been in an assertive downtrend as central banks have moved into a tightening regime following inflationary pressures.
But these bear markets often see swift and aggressive counter-trend rallies.
For short-term active traders, these moves are a nice way to capture a quick buck provided you're nimble in your profit-...
Last week the US Healthcare Sector hit new multi-year highs relative to the S&P500.
The Relative Strength has already been there under the surface.
And when you look at Healthcare on an absolute basis you can see the sideways digestion of prior gains during a period where most stocks and indexes were falling:
The largest insider transaction on today’s list is a Form 4 filing by Nimish P. Shah, who reported a purchase of roughly $5.1 million of Tricida $TCDA.
Thomas Meth, the president of Enviva $EVA, reported a purchase of 8,600 shares, equivalent to $505,508 worth of stock.
We retired our "Five Bull Market Barometers" in 2020 to make room for a new weekly post that's focused on the three most important charts for the week ahead.
This is that post, so let's jump into this week's edition.
When one of the most important procyclical assets breaks to fresh 52-week lows, it takes center stage. It also has major implications across a variety of markets.
But what about energy? What about grains and softs and the rest of the commodity space?
Well, most of those contracts have already been in correction mode.
And, based on the recent selloff in energy and other commodity-related stocks, a much deeper correction could be in store for these raw materials.
It’s definitely something we’re monitoring. And that’s where copper and today’s chart in focus come into play.
Let’s take a look.
Here’s an overlay chart of copper futures and the five-year breakeven inflation rate:
These two charts look almost identical. That's because copper and commodities, in...
Our International Hall of Famers list is composed of the 100 largest US-listed international stocks, or ADRs. We’ve also sprinkled in some of the largest ADRs from countries that did not make the market-cap cut.
These stocks range from some well-known mega-cap multinationals such as Toyota Motor and Royal Dutch Shell to some large-cap global disruptors such as Sea Ltd and Shopify.
It’s got all the big names and more--but only those that are based outside the US. You can find all the largest US stocks on our original Hall of Famers list.
The beauty of these scans is really in their simplicity.
We take the largest names each week and then apply technical filters in a way that the strongest stocks with the most momentum rise to the top.
Based on the market environment, we can also flip the scan on its head and filter for weakness.
Let’s dive in and take a look at some of the most important stocks from around the world.
This is a good time to think about what could happen after the midterms because the run-up to this fall’s elections could be almost unbearable. The Fed, the Supreme Court and lingering fights over the 2020 election will provide candidates of all stripes with plenty of political fodder. The public mood is already dour and an onslaught of negative ads is not likely to help. History and conventional wisdom suggest stocks could struggle for traction over the summer, find a low prior to the election and then rally as the outcome becomes evident. The S&P 500 has been higher 12 months after every single mid-term election since at least 1950. The problem with that information is that it is being widely discussed. The data is what it is and the past is all we have to go on. Nonetheless, the words of Bernard Baruch seem relevant right now: “Something that everyone knows isn’t worth anything.”
An alternative view is that the pattern of the S&P 500 since its early year peak is not dissimilar to what was seen...
The stock market has breathed a much-needed sigh of relief this week.
Are we out of the woods? I wish I knew.
But in case we're not, I'm hedging a little bit by taking this bounce opportunity to get into a bearish position in an Electric power generation stock that appears to be dead-cat bouncing.
We debuted a new scan recently which goes by the name- All Star Momentum.
All Star Momentum is a brand new scan that guides us towards the very best stocks in the market. We have incorporated our stock universe of Nifty 500 as the base this time around. Among the 500 stocks that we follow, this scan will pump out names that are most likely to outperform the market.