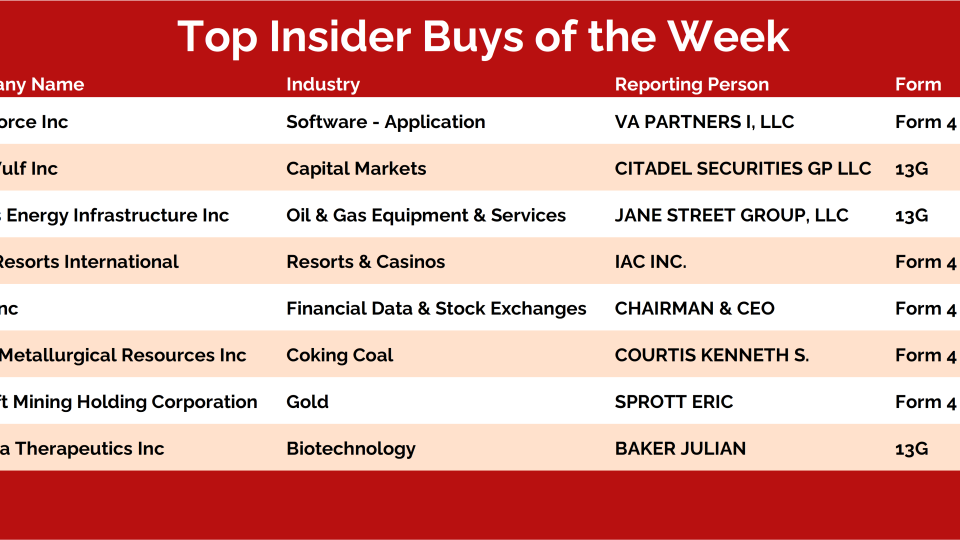
Bitcoin continues to rally higher, hitting 50,000 for the first time since March 2022.
New York expands fraud case against DCG to $3B.
Binance is losing dominance against other crypto venues, with spot volume dominance falling from 60% to 40% throughout 2023. This has been accelerated with CME open interest overtaking Binance in recent months.
FEATURED CHART
Here is Bitcoin dominance YTD; this is calculated by dividing Bitcoin's market capitalization by the total market capitalization of the asset class. As Bitcoin market-cap dominance rises, it suggests that Bitcoin is outperforming most of the asset class.
Following the approval of the Bitcoin spot ETFs, Bitcoin dominance sharply fell but has now quickly recovered as crypto markets have stair-stepped higher. This points to Bitcoin's outperformance relative to smaller market-cap altcoins.
We've had some great trades come out of this small-cap-focused column since we launched it back in 2020 and started rotating it with our flagship bottom-up scan, Under the Hood.
For the first year or so, we focused only on Russell 2000 stocks with a market cap between $1 and $2B.
That was fun, but we wanted to branch out a bit and allow some new stocks to find their way onto our list.
We expanded our universe to include some mid-caps.
To make the cut for our Minor Leaguers list now, a company must have a market cap between $1 and $4B.
And it doesn't have to be a Russell component — it can be any US-listed equity. With participation expanding around the globe, we want all those ADRs in our universe.
The same price and liquidity filters are applied. Then, as always, we sort by proximity to new highs in order to...
We held our February Monthly Strategy Session last week. ASC Premium Members can click here to watch the replay and download the chartbook.
Non-members can get a quick recap of the call simply by reading this post each month.
By focusing on long-term, monthly charts, the idea is to take a step back and put things into the context of their structural trends.
This is easily one of our most valuable exercises as it forces us to put aside the day-to-day noise and simply examine markets from a “big-picture” point of view.
With that as our backdrop, let’s dive right in and discuss three of the most important charts and/or themes from this month’s call.
Healthcare continues to lead to the upside. While we already have a bullish bet on a sector ETF, it's time for us to drill in a little deeper in search of more beta if this trend is going to continue.
Today's trade is in a name that has been performing great off its December lows and has also been in a longer-term bull market. But only just recently has it begun to outperform against the broader stock market.
Bitcoin has erased its post-ETF losses, with prices hitting 48,000.
The greatest percentage of cryptocurrencies made new highs since the short-term market top in December last year.
Bitcoin spot ETFs have surpassed 200,000 BTC in AUM within their first month of trading.
FEATURED CHART
Here is a daily price chart of Bitcoin making 52-week closing highs. A number of data points pointed to a reset in the consensus bullish positioning and sentiment that had become dominant over the recent months. Now, it appears the 40,000s have become a new floor in this bull market.
WHAT TO LOOK OUT FOR
We want to see Bitcoin hold 46,000 on the upside, but should we see mean reversion manifest from this recent move, we’d anticipate the 40,000s to provide support on the downside.
We’re closely monitoring Bitcoin dominance. As it stands,...
In last week’s letter, we argued that a once-crowded bullish sentiment had cooled down in a bull market reset. We also put forward the case that crypto markets were at an inflection point between capitulation or reacceleration. Over the last week, we’ve seen Bitcoin sharply rally to the high 40,000s, indicating that this period of consolidation is ending with an upward resolution.
As we exit the best three-month period for the stock market, we're looking to our risk appetite indicators to help us determine the next directional move.
The charts below are all excellent tools for helping identify what kind of environment we are in.
During bull markets, investors embrace risk. In bear markets, they reduce their risk.
Understanding and analyzing the balance between defensive and offensive assets helps keep us on the right side of the trend.
Breaking News: "Dow Futures fell 100 points and the VIX rose this Friday on news of new all-time highs for the stock market"
The breadth continues to deteriorate with every week that goes by.
You notice?
You can see it in our trades as well. While the puts on our $SPY and $QQQ haven't started to work yet, the bearish trades on individual stocks are all either working or flat.
It's interesting. What you see in happening in the portfolio, you can also see happening in the market itself.
We saw new all-time highs this week for the S&P500. But we had the fewest stocks in the S&P500 above their 200 day moving average since December. And the fewest above their 50 day moving average since November.
Our Hall of Famers list is composed of the 150 largest US-based stocks.
These stocks range from the mega-cap growth behemoths like Apple and Microsoft – with market caps in excess of $2T – to some of the new-age large-cap disruptors such as Moderna, Square, and Snap.
It has all the big names and more.
It doesn’t include ADRs or any stock not domiciled in the US. But don’t worry; we developed a separate universe for that. Click here to check it out.
The Hall of Famers is simple.
We take our list of 150 names and then apply our technical filters so the strongest stocks with the most momentum rise to the top.
Let’s dive right in and check out what these big boys are up to.
Here’s this week’s list:
*Click table to enlarge view
We filter out any laggards that are down -5% or more relative to the S&P 500 over the trailing month.
Then, we sort the remaining names by their proximity to new 52-week highs.