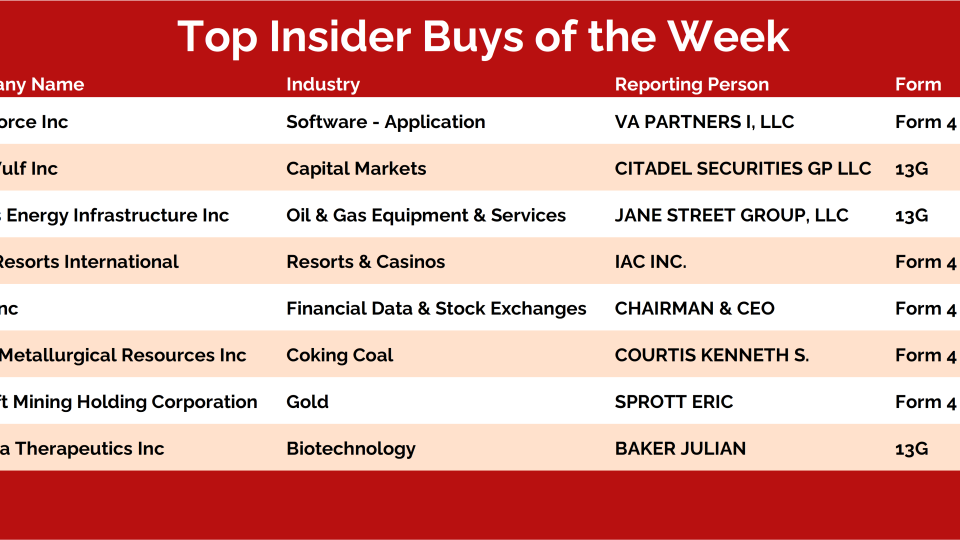
Displaying 9793 - 9816 of 17399

Do You Own The Right FANG?

February 12, 2022

What's amazing to me is how many investors have owned the wrong FANG this whole time.

Instead of owning Diamondback Energy, ticker symbol: $FANG, they owned a bunch of growth stocks.

All Star Charts Premium

Saturday Morning Chartoons: Noise vs Price

February 12, 2022

It's Saturday Morning Chartoons time. 

This is the weekly post that aggregates all the charts we put together throughout the week and organizes them all into one, easy to flip through deck.

You can find the whole list of trades here.

Below you'll find the full PDF of this week's charts:


All Star Charts Premium

The Hall of Famers (02-11-2022)

February 11, 2022

From the desk of Steve Strazza @Sstrazza

Our Hall of Famers list is composed of the 150 largest US-based stocks.

These stocks range from the mega-cap growth behemoths like Apple and Microsoft – with market caps in excess of $2T – to some of the new-age large-cap disruptors such as Moderna, Square, and Snap.

It has all the big names and more.

It doesn’t include ADRs or any stock not domiciled in the US. But don’t worry; we developed a separate universe for that which you can check out here.

The Hall of Famers is simple.

We take our list of 150 names and then apply our technical filters so the strongest stocks with the most momentum rise to the top.

Let’s dive right in and check out what these big boys are up to.

Here’s this week’s list:

And here’s how we arrived at it:

  • We filtered out any stocks that are below their May 10th 2021 high, which is when...
All Star Charts Premium

Participation Grows for Commodity Stocks

February 11, 2022

From the desk of Steven Strazza @Sstrazza and Ian Culley @Ianculley  

It’s only six weeks into the new year and we’re already getting a sense that commodities could very well outperform just as they did in 2021.

Evidence supporting our commodity supercycle thesis continues to mount each day, as participation across the commodity space expands.

Crude oil is breaking above 90. Base metals like aluminum and tin are hitting new all-time highs. And the rally in grains is getting back on track.

All these things suggest that last year's bull run wasn’t a simple “one and done” event.

One key difference between last year and today is strength among commodities is starting to spill over into commodity-related equities.

This is a critical development that supports our bullish thesis. 

Today, we’re going to run through some stocks, highlighting the renewed strength from some of these...

Deep Dive Into REITs

February 11, 2022

In a market that's going sideways, it can become quite frustrating to figure out what the trend is. More often than not, there are certain sectors that perform well and certain sectors that don't. But it's also important to identify other avenues of investment that could generate good returns over a period of time.

Today we're exploring one such theme in the form of REITs. Read on, to learn more.

[PLUS] Weekly Observations & One Chart for the Weekend

February 11, 2022

From the desk of Willie Delwiche.

There are no magic indicators that are right 100% of the time, no silver bullets, no “one Ring to rule them all.” That’s why we spend so much time talking about weighing the evidence and looking at the behavior of risk on and risk off indicators. That being said, there are times when one indicator or another seems particularly relevant. That is now the case with the number of stocks making new highs and new lows on the NYSE+NASDAQ. The spread between new highs and new lows peaked in early 2021 and was fading (though stayed positive) for much of the year. The situation deteriorated in November and new lows started to outnumber new highs. Even as the indexes moved off of their January lows, we’ve continued to see more stocks making new lows than new highs. Since 2000 all of the net gains in the major US indexes (S&P 500, NASDAQ Composite, Russell 2000, Value Line Geometric Index) have come when the cumulative net new high list has been expanding. The bottom line is that history suggests the indexes could continue to struggle so long as new lows are outnumbering new highs. 

...

All Star Options

[Options Premium] Giving the Homies a Rest

February 11, 2022

While certainly not at panic levels, we've been seeing a persistent $VIX holding north of 20, and the last two days we saw it flirt with 25. This signals to me that there is still a bit of uneasiness remaining in the stock market, leftover from the recent correction.

Scanning my books, I noticed my portfolio is a little light on delta neutral premium trades, so we're going to take the recent rise in volatility as an opportunity to add a little diversification.

As always, I take a gander at my list of the most liquid ETF options and look for the ones with the highest implied volatilities right now. And then if the chart suggests some consolidation is in order, that's where I look to strike.

When The Ride Ends....

February 11, 2022

Did The Economist just call the bottom for the market?

Take a look at the latest cover.

They're asking the question, "What would happen if the markets crashed?"

Crypto: What Will It Be?

February 11, 2022

As technicians, our job is to respond and react to the evidence in front of us.

The market has a funny way of punishing those who let their ego and opinions drive their decision-making instead of objectively following money flow.

We say it over and over again: As a trader, your only job is to follow money flow. Everything else is noise.

This morning, we can't help but think about the resolution from this rally seen in a handful of crypto stocks. I think Microstrategy $MSTR and Coinbase $COIN show it better than any other.

What will it be?

My Most Expensive Options Lesson

February 10, 2022

I have one trade that stands out head and shoulders above the rest as my number one F-up. I really screwed this one up.

Financially, it was my best trade of the year. Probably my best trade in several years…

But it still stands out as my worst trade of all time.

This was circa 2013. I had recently moved to Boulder, CO and life was good. New vistas, new friends, new environments, new everything.

And one thing I did which was new for me (at the time), was I had come up with a long-term bullish thesis on a stock. And over the course of a couple days, I wrote up about 5 pages of notes on my yellow legal pad outlining exactly how I’d play my bullish thesis using options.

The TL;DR version of my strategy is that I was going to purchase slightly out-of-the-money long calls with about a month until expiration. And then if/when the stock traded up and through the strike price of my long calls, I would take that opportunity to roll those options up and out to the next monthly series, using the proceeds from the sale of the existing ITM options to purchase as many new OTM options in the next month as possible. (For example, I’d sell 5 calls with...

Breadth Thrusts & Bread Crusts: Fed Up With Inflation

February 10, 2022

From the desk of Willie Delwiche.

There is plenty of chatter today about inflation, the bond market, and the Fed. 

I have a couple charts to share – and a couple key points worth making. 

Inflation continues to run much hotter than a year ago and the Fed is still playing catch-up. The yearly change in the median CPI was at its highest level in a decade going into COVID, and is now at its highest level in 30+ years. Pressure is not letting up, and the 3-month change in the median CPI has surged to its highest level on record.

Your Tools vs Absolutes

February 10, 2022

This week we got a terrific reminder about weighing all the evidence properly from new Miami Dolphins head coach Mike McDaniel.

In a recent podcast, the new Dolphins coach was asked about the role of analytics in today's game and how it impacts his decision making.

I thought McDaniel's answer was a great one and really resonates with how we approach markets here at All Star Charts,

All Star Charts Premium

European Yields Lead the Way

February 10, 2022

From the desk of Steven Strazza @Sstrazza and Ian Culley @IanCulley

The middle of the curve is catching higher as the US 10-year Treasury yield pushes toward its next milestone at 2.00%.

Now that we’re starting to see some follow-through to the upside, it raises the question…

Are these new highs in the 10-year sustainable?

With inflation expectations just off their highs, short-term rates surging in the US, and yields ripping higher across the globe, we think the answer is a resounding yes

A few weeks ago, we discussed how global yields -- particularly those in developed Europe -- were confirming the new highs for US yields.

Since then, we've only seen this trend accelerate. With central banks turning increasingly hawkish, rates continue to break out to new highs around the world.

Today, we're going to dive further into this theme by taking a look at a handful of benchmark rates outside the US. 

Let’s dive in!

First up is the German 10-year:

...

All Star Charts Premium

The Short Report (02-09-2022)

February 10, 2022

From the desk of Steve Strazza @Sstrazza

When investing in the stock market, we always want to approach it as a market of stocks.

Regardless of the environment, there are always stocks showing leadership and trending higher.

We may have to look harder to identify them depending on current market conditions… but there are always stocks that are going up.

The same can be said for weak stocks. Regardless of the environment, there are always stocks that are going down, too. 

We already have multiple scans focusing on stocks making all-time highs, such as Hall of Famers, Minor Leaguers, and the 2 to 100 Club. We filter these universes for stocks that are exhibiting the best momentum and relative strength characteristics. 

Clearly, we spend a lot of time identifying and writing about leading stocks every week, via multiple reports.

But, now, we’re also highlighting lagging stocks on a recurring basis.

...

The Outperformers

February 9, 2022

We debuted a new scan recently- The Outperformers.

The Outperformers is our newest scan that pinpoints the very best stocks in the market. It’s the fastest, easiest way to find quality names that are primed for major moves.

The goal is that as the market rally progresses, the sector rotation within the market will reflect in this scan. So while our Top/Down Analysis helps us with the broader view of the market, this Bottom/Up scan makes sure that we catch the slightest change in sentiment.

[PLUS] Weekly Sentiment Report

February 9, 2022

From the desk of Willie Delwiche.

Key Takeaway: Sentiment has unwound to a point that it’s now seen as an opportunity rather than a risk. Pessimism runs high, investors are cranky, and we have had the most bears since 2016. On top of that, our universe of risk-on/risk-off ratios continues to lean toward the risk-off side of the scale. There are signs of budding pessimism (Consensus bulls have risen for the second week in a row and the NAAIM exposure index fails to register excessive pessimism) after the recent bounce in the major equity indexes. But without a strong enough reaction to produce meaningful breadth thrusts it’s difficult to be bullish on the broader market.       

Sentiment Report Chart of the Week: Sentiment Composite Points To Opportunity

Sometimes the best approach is to set aside movements in individual indicators and look at an aggregate. Our Sentiment Composite has moved from being a market headwind in early 2021 to a tailwind now in 2022. After pessimism reaches an extreme,...