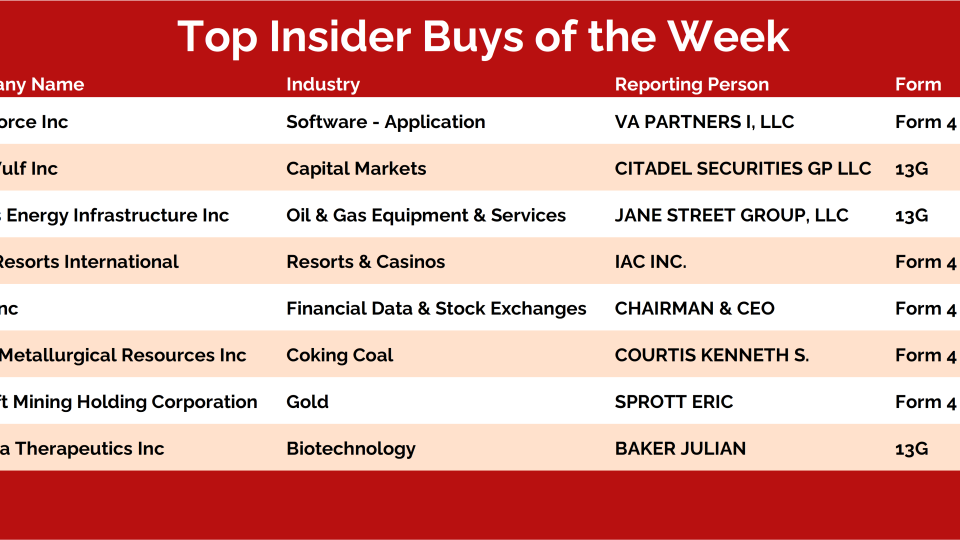
Key Takeaway: Bonds make good on their resolution to take rate hikes more seriously. Breadth thrust prospects are fading but global resiliency is encouraging. Fed will be late to the rate hiking party and so recent tightening cycles may not be as relevant.
Sector-level volatility is producing big swings in relative strength rankings. Thanks to a double-digit positive weekly return (while the median sector was down), Energy surged to the top of our rankings, followed by Consumer Staples in the number two spot.
Financials also surged in the rankings and joined Staples and Energy in making new highs last week.
Health Care, Technology and Consumer Discretionary all plummeted in the rankings, with weakness being seen across various capitalization levels.
In this weekly note, we highlight 10 of the most important charts or themes we're currently seeing in asset classes around the world.
Commodities Keep Cruising
Despite copper remaining range-bound and the CRB index stuck below its October highs from last year, our equal-weight commodity index hit fresh 8-year highs last week. This speaks to broad participation and strength among commodities, and is supportive of our view that a new commodity supercycle is upon us. This index making new highs is also excellent confirmation of the breakouts in the US 10-year yield, and energy and financial stocks. We think these areas of the market will continue to do well. Though we’re definitely not out of the woods, we are beginning to see signs that the market is finding its way. Our equal-weight commodity index at its highest level in eight years is definitely one for the bulls. After a prolonged period of consolidation in 2021, we think commodities are ready to make a fresh leg higher.
On days and weeks like this, I love to look for opportunities to sell premium into the elevated implied volatilities we're seeing rising across the board. With $VIX back up above 20, you'd think there's been plenty to pick from.
Problem is, I haven't found any delta-neutral setups that look good today. Too many busted charts on the most liquid ETFs makes finding support levels that both make sense and offer enough premium to make it worthwhile from a safety standpoint hard to find.
So, as always, I reached out to my team from some other ideas.
We've been asking the question: "how bad can things be if we're seeing this kind of relative and absolute strength in the banking and financial sectors?"
Steve Strazza served up an interesting bullish play that is either a gift of a pullback, or we're buying the top. If you're market the bullish, then you gotta believe this idea has merit.
Check out this week's Momentum Report, our weekly summation of all the major indexes at a Macro, International, Sector, and Industry Group level.
By analyzing the short-term data in these reports, we get a more tactical view of the current state of markets. This information then helps us put near-term developments into the big picture context and provides insights regarding the structural trends at play.
Let's jump right into it with some of the major takeaways from this week's report:
* ASC Plus Members can access the Momentum Report by clicking the link at the bottom of this post.
Macro Universe:
Our macro universe was red this week as 68% of our list closed lower with a median return of -0.71%.
The US 10-Year Yield $TNX was the winner, gaining about 26bps on the week.
The biggest loser was Russell 1000 Growth $IWF, with a weekly loss of -4.84%.
There was a 4% drop in the percentage of assets on our list within 5% of their 52-week highs – currently at 51%.
21% of our macro list made fresh 4-week highs, 13...
Over the last few weeks, we've been pointing to the growing leverage in the derivative markets exacerbating volatility.
In our last report, we also outlined how we're anticipating this to unwind in the coming weeks. This continues to be the key theme for the first quarter.
Additionally, a variety of metrics suggest the market is strongly in oversold conditions, offering a favorable level for long-term investors to add to spot positions.
Meanwhile, derivatives and macro conditions present a headwind for speculative dip-buyers.
We retired our "Five Bull Market Barometers" in 2020 to make room for a new weekly post that's focused on the three most important charts for the week ahead.
This is that post, so let's jump into this week's edition.
Our International Hall of Famers list is composed of the 100 largest US-listed international stocks, or ADRs. We’ve also sprinkled in some of the largest ADRs that did not make the market-cap cut.
These stocks range from some well-known mega-cap multinationals such as Toyota Motor and Royal Dutch Shell to some large-cap global disruptors such as Sea Ltd and Shopify.
It’s got all the big names and more -- but only those that are based outside the US. You can find all the largest US stocks on our original Hall of Famers list.
The beauty of these scans is really in their simplicity.
We take the largest names each week and then apply technical filters in a way that the strongest stocks with the most momentum rise to the top.
Based on the market environment, we can also flip the scan on its head and filter for weakness.
Let’s dive in and take a look at some of the most important stocks from around the world.
Before we get into it, let's take a look at how our International Hall...
From the desk of Steven Strazza @Sstrazza and Ian Culley @Ianculley
Crude oil bulls are back in town!
They kicked the year off by pushing price back above 76 and reclaiming the upper bounds of a multi-year base. Oil is the most important commodity in the world, so it’s hard to overstate just how bullish fresh seven-year highs would be.
But we’re not quite there yet. We still need to take out the fall highs.
The 76 level marks the former 2018 highs and the breakout from a massive reversal pattern. Buyers ran into an overwhelming amount of supply here during the back half of 2021. When they did manage to reclaim those former highs, it was short-lived, and the move quickly failed.
The stock market’s reaction to this week’s sharp rise in bond yields has intensified talk of a durable shift in long-term equity leadership, within the US as well as on a global basis. That discussion leads to questions about the best way to visually represent such shifts and what relationships we want to keep our eyes on for evidence that such a shift is indeed taking place. In terms of shifting US leadership, you could do a lot worse than the ratio between the old AMEX Composite (technically now it is the NYSE Mkt Composite) and the S&P 500. The AMEX Composite has less of a mega-cap, tech-sector focus than does the SP& 500. S&P 500 leadership peaked in the late 1990’s and this was followed by a decade of relative strength out of the AMEX. The following decade was again dominated by the S&P 500, but over the past year, the AMEX has perked up and looks ready to wear the leadership mantle again. Getting above its June and November highs versus the S&P 500 would be strong evidence that it is ready for that role. Despite carnage elsewhere to begin 2022, the AMEX Composite closed at a new high as recently as...
The most speculative areas of the market peaked in Q1 of 2021 and have been under pressure ever since. It’s not just IPOs and SPACs. Areas like biotech, social media, and online retail have completely fallen out of favor too.
Many of the stocks that have been selling off were among the top performers off the COVID lows in 2020. Some of these former leaders are in 60% to 70% drawdowns today.
What a difference a year can make!
Now that we’re getting closer and closer to the first rate hike, the prevailing opinion seems to be that these stocks will remain under pressure. As things currently stand, there's not much on the charts to suggest they're ready to turn things around.
On the other hand, some of these industry groups are already more than 30% off of their highs -- and that’s at the index level. Eventually, further downside would be inconsistent with the idea that stocks are in a bull market.
For the health of the overall market, we want to see these stocks stop selling off so aggressively. Despite the volatility this week, there are some signs that this is happening.
The first two days of this week completed a nearly text book Santa Claus rally. Then on Wednesday, it appears the Fed may have stolen his Sleigh and now his reindeer have no idea which way to steer!
This indecision has played out in the options market by raising the risk premiums being asked across a wide sector of index ETFs.
At times like this, I like to go hunting for premium-selling opportunities. And I've got one teed up so lets get to it!
I don't have a lot of faith in people, or media or economists. But bonds are something we certainly take seriously.
There's no bullshit with them.
The biggest players in the world have no choice but to be intimately involved in fixed income markets. So if you're curious which way the pendulum is swinging, you'll be able to see it in bonds.
Here's a quick look at US Interest Rates making new highs - from the 1yr to 10yr yields these are going towards the upper right: