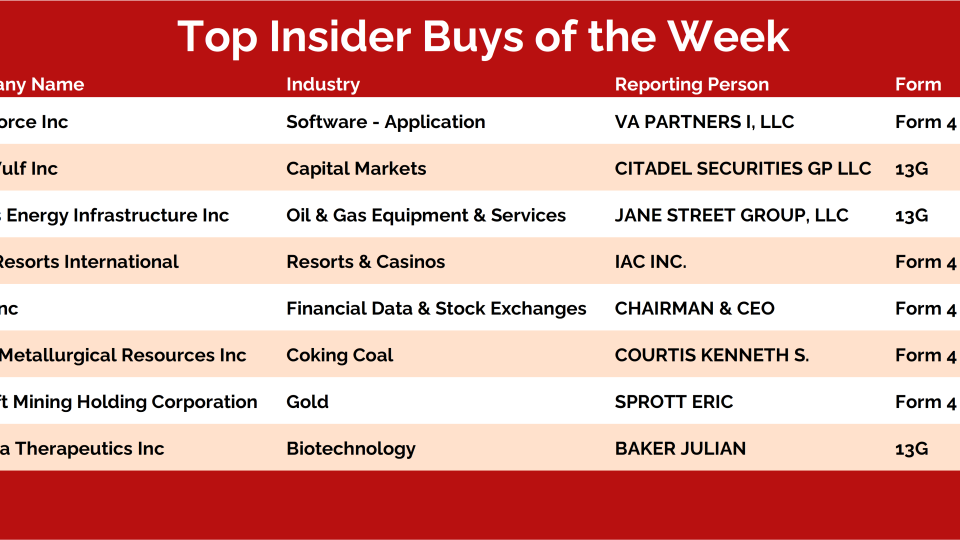
The Outperformers is our newest scan that pinpoints the very best stocks in the market. It’s the fastest, easiest way to find quality names that are primed for major moves.
The goal is that as the market rally progresses, the sector rotation within the market will reflect in this scan. So while our Top/Down Analysis helps us with the broader view of the market, this Bottom/Up scan makes sure that we catch the slightest change in sentiment.
We held our November Monthly Strategy Session last night. Premium Members can access and rewatch it here.
Non-members can get a quick recap of the call simply by reading this post each month.
By focusing on long-term, monthly charts, the idea is to take a step back and put things into the context of their structural trends. This is easily one of our most valuable exercises as it forces us to put aside the day-to-day noise and simply examine markets from a “big-picture” point of view.
Let’s dive in and discuss three of the most important charts and/or themes from this month’s call.
We’ve made some changes to our ASC+Plus Dynamic Portfolios.
With the weight of the evidence turning more bullish, we have increased our equity exposure in the cyclical and tactical opportunity portfolios.
Within these portfolios we have also moved away from equity areas that are struggling to participate in the rally and re-focused exposure on areas that are experiencing upside momentum.
Energy futures are resolving higher from multi-year bases. Stocks are pressing to new highs all along the cap scale. And the more cyclical, value-oriented markets are catching a bid and becoming leadership groups again -- think financials and energy.
It appears everything is falling into place. But a few pieces are still missing…
For instance, you might assume the US dollar is under pressure as commodities and stocks outperform.
But it’s not.
In fact, the dollar made new 52-week highs not long ago and has since consolidated at the top of its range while riskier areas of the currency market have struggled to catch a bid.
We’ve highlighted the US Dollar Index and the mixed signals coming from developed currencies in recent posts.
The buzzword over the last few days has been the "Metaverse", but what is it, and why should we care?
Breaking all the headlines last week was the big tech news that Facebook was changing its name to Meta, realigning it with its future goals and ambitions. The metaverse is seen as the next iteration of the internet through virtual reality, primarily as a new way of experiencing the world of social media.
Following all this talk, virtual reality and gaming cryptocurrency protocols have caught a nice bid, with Decentraland and Sandbox up over +320% and +250%, respectively, since the Facebook Connect event.
And just take a look at the explosion in google searches about the metaverse:
This has acted as an immediate tailwind for the crypto and decentralized protocols pushing this technology and has certainly been a pocket of the asset class that is garnering plenty of attention.
Monthly Charts are very important to us. As a team, we regroup several times, but monthly charts put us on the same page, without having to discuss it.
Process is an important aspect of any activity. And so, Monthly Charts analysis is an important aspect of our research. Without this, it is easy to get swayed in the short-term moves and get carried away by them.
You can sign up for our Monthly Strategy Call and get the whole update of the market. We're here to provide a glimpse of what's going on.
Welcome back to our latest "Under The Hood" column where we'll cover all the action for the week ended October 29, 2021. This report is published bi-weekly and rotated on-and-off with our "Minor Leaguers" column.
What we do here is analyze the most popular stocks during the week and find opportunities to either join in and ride these momentum names higher, or fade the crowd and bet against them.
We use a variety of sources to generate the list of most popular names. There are so many new data sources available that all we need to do is organize and curate them in a way that shows us exactly what we want: A list of stocks that are seeing an unusual increase in investor interest.
This is one of our favorite bottom-up scans: Follow The Flow. In this note, we simply create a universe of stocks that experienced the most unusual options activity — either bullish or bearish… but NOT both.
We utilize options experts, both internally and through our partnership with The TradeXchange. Then, we dig through the level 2 details and do all the work upfront for our clients. Our goal is to isolateonlythose options market splashes that represent levered and high-conviction, directional bets.
We also weed out hedging activity and ensure there are no offsetting trades that either neutralize or cap the risk on these unusual options trades. What remains is a list of stocks that large financial institutions are putting big money behind… and they’re doing so for one reason only: because they think the stock is about to move in their direction and make them a pretty penny...
Key Takeaway: Index strength fueled by new found momentum. New highs lists are expanding, but not very rapidly. Persistent inflation, sputtering growth are a headache for the Fed.
Consumer Discretionary has been the top-performing large-cap sector on a short-term basis and was one of only two large-cap sectors to make new highs last week (Information Technology was the other). The sector’s relative strength at the large-cap level is not echoed among mid and small-caps, but it is still fairly broad-based (it’s equal-weight ranking matches its cap-weight ranking).
Energy and Financials have lagged on a short-term basis, but remain at the top of our relative strength rankings across size levels.
The ASC team put out their latest International Hall of Famers list late last week. Here's what you need to know about these stocks: These are the 50 largest US-listed international stocks, or ADRs, which the team has applied technical filters to in a way that the strongest stocks with the most momentum rise to the top.
And one that caught my interest just recently got its last quarterly earnings reveal out of the way and it is now trading above the level where we want to take action.
In this weekly note, we highlight 10 of the most important charts or themes we're currently seeing in asset classes around the world.
Stocks Still Flirting With Former Highs
Large-caps continue to be leaders as the S&P 500 and Russell 1000 made decisive upside resolutions this past week. Mid-caps aren’t far behind with the S&P 400 pressing back above its year-to-date highs. However, small-caps are still trading in a range and have yet to make new highs. The bet we’re making is that all of these eventually resolve in the same direction. With mid and large-caps leading the way and holding firm above their breakout levels, we think it’s only a matter of time until small-caps follow.
Check out this week's Momentum Report, our weekly summation of all the major indexes at a Macro, International, Sector, and Industry Group level.
By analyzing the short-term data in these reports, we get a more tactical view of the current state of markets. This information then helps us put near-term developments into the big picture context and provides insights regarding the structural trends at play.
Let's jump right into it with some of the major takeaways from this week's report:
* ASC Plus Members can access the Momentum Report by clicking the link at the bottom of this post.
Macro Universe:
Our macro universe was a split decision this week as 51% of our list closed higher with a median return of 0.01%.
The Volatility Index $VIX was the big winner, closing out the week with more than a 5% gain.
Once again, the biggest loser was Lumber $LB, with a weekly loss of -11.38%
There was a 2% drop in the percentage of assets on our list within 5% of their 52-week highs – currently at 64%.
The market is still constructively absorbing overhead supply, which hasn't been surprising to see take place.
Periods of consolidation like this allow sentiment and positioning to cool down while the market prepares for its next leg higher. If Bitcoin is above 59,000, we're making the bet that the shakeout is in the process of completing, and prices will eventually move back to their former all-time highs above 65,000.
But as we'll walk through in today's note, we're waiting for prices to ultimately reclaim 65,000 before we hold much conviction on further upside.
This week we’re looking at a long setup in the Infrastructure sector. The market has been quite selective over the past two weeks but we saw strength come through in pockets. Here is one such example.
We retired our "Five Bull Market Barometers" in mid-July last year to make room for a new weekly post that's focused on the three most important charts for the week ahead.
This is that post, so let's jump into this week's edition.
If you say 20% price appreciation it's probably because you watch too much basic cable.
Are a majority of stocks going higher or are a majority of stocks going lower?
That's how we determine bull and bear markets.
And by the way, individual stocks do NOT have bull and bear markets. The concept of a bull or bear market is a broad market description, not reserved for individual stocks.
If anyone ever tells you that an arbitrary 10% move is a "correction" and 20% is a bull/bear market, then you know they can't be trusted. It's that simple. Move on.
So if you're interested in the way markets actually work, as of earlier this month, when breadth improved, we proclaimed that the ...