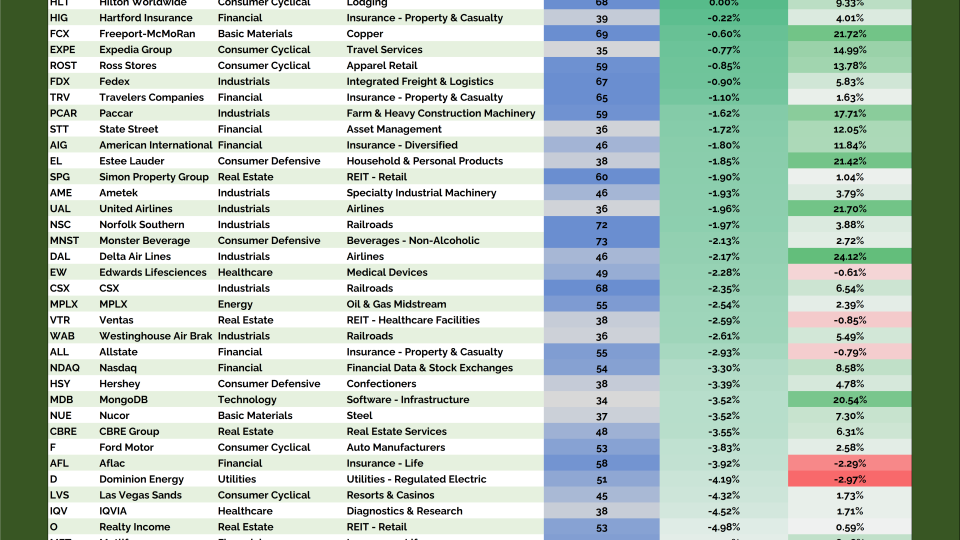
Displaying 7993 - 8016 of 17528

All Star Charts Premium

The Good, the Bad, and the Ugly

October 14, 2022

From the Desk of Ian Culley @IanCulley

The commodity markets never lack action. 

Since it’s such a diverse asset class, we’ll always have contracts we want to buy, some that we want to short, and others we want to avoid.

Today, I’m going to outline one of each. Let’s dive in!

The Breakout

According to the latest reports, Hurricane Ian (strong name, terrible storm) may have cut the Florida orange crop in half.

Whether it’s true doesn’t matter. I’m more concerned with a well-defined level to trade against. Check out the daily chart of orange juice futures:

The chart looks good to me! A five-month base breakout to fresh five-year highs is the kind of strength I like to buy.

The line in the sand is 191. You can get long above this level with an initial target of 220 and a secondary objective of 242.50.

Remember, OJ futures are thinly traded. You need to adjust your...

[PLUS] Weekly Observations & One Chart for the Weekend

October 14, 2022

From the Desk of Willie Delwiche.

Labor Pressure Eases - Is Inflation Next?

The Chart: 

On the labor front, job openings turned lower in August and the Atlanta Fed’s Wage Growth Tracker for September seems to have followed suit. On the inflation front, the year change in the median CPI reached another new high (its 7th in a row) in September.

Why It Matters: 

Despite a bevy of other explanations, surging inflation has had more to do with imbalances in the labor market than anything else. A drop in job openings (while not a sign of strength) is a more preferable way to restore labor market balance than increased layoffs and unemployment. With wage growth now slowing, the hope is that inflation could soon peak. The challenge is that once the inflation genie is loose it can be hard to get under control - even if the initial causes are mitigated. In that regard, this month’s jump in inflation expectations reported with the University of Michigan Consumer Sentiment Survey is unwelcome news for the Fed...

All Star Options

[Options Premium] Hiding Out With the Aristocrats

October 14, 2022

While this certainly is not the market environment to be taking aggressive long bets in, there are some stocks that are displaying tremendous relative strength that we can play with strictly defined-risk positions to protect ourselves.

Our Young Aristocrats Report shows us stocks that aren’t just paying dividends but are doing so while they’re going up and thus paying us via price appreciation as well.

And this week's report serves up a great opportunity.

Chart of the Day: Major Market Trends

October 14, 2022

There are a lot of trends in markets that are worth paying attention to.

Remember, asset prices trend. They're not random.

We have the data.

So one major trend we want to make sure we're not ignoring is in Energy stocks relative to Technology.

Look at the ratio between them making new multi-year highs, yet the S&P500 weighting in energy is still less than 5% of the entire index. But Technology is still almost 25% of the index.

Is that weighting sustainable?

All Star Charts Premium

Bonds Slice and Dice

October 13, 2022

From the Desk of Ian Culley @Ianculley

Don’t catch falling knives!

It sounds simple enough. But in reality, traders continue to lose fingers as they reach for downtrending assets.

Diving after downtrends isn’t one of my many afflictions. But I do have a theory…

Traders and investors don’t realize they're catching a falling knife in the moment. They believe they’re bargain-hunting.

So if you’re one of the many investors out there mending fresh wounds this week, I want to make one thing clear…

Bonds are a falling knife.

Check out the chart of the 30-year T-bond:

Do you really want to buy this chart?

Sure, the downtrend is stretched and ripe for some mean reversion. But as long as it’s below 127’23 we’re short with a target of 116. 

It’s the same story with $TLT:

I can’t buy a chart that’s breaking down to fresh 8-year lows. It doesn’t make sense to me...

All Star Charts Premium

Young Aristocrats (October 2022)

October 13, 2022

From the desk of Steve Strazza @Sstrazza

Dividend Aristocrats are easily some of the most desirable investments on Wall Street. These are the names that have increased dividends for at least 25 years, providing steadily increasing income to long-term-minded shareholders.

As you can imagine, the companies making up this prestigious list are some of the most recognizable brands in the world. Coca-Cola, Walmart, and Johnson & Johnson are just a few of the household names making the cut.

Here at All Star Charts, we like to stay ahead of the curve. That's why we're turning our attention to the future aristocrats. In an effort to seek out the next generation of the cream-of-the-crop dividend plays, we're curating a list of stocks that have raised their payouts every year for five to nine years.

We call them the Young Aristocrats, and the idea is that these are "stocks that pay you to make money." Imagine if years of consistent dividend growth and high momentum and relative strength had a baby, leaving you with the best of the emerging dividend giants that are outperforming the averages.

By adding our technical analysis to the mix, the Young...

Swing Trader Pro: Morning Briefing (10-13-2022)

October 13, 2022

From the Desk of Kimmy Sokoloff

As I write this morning, the futures are trading higher, with the SPX at 3,600 ahead of the release of September CPI data.

I'd like to see the SPX hold onto 3,600 and trend higher from here, but time will tell.

The levels to watch on the $SPY are support at 355.71, then 354.15. Resistance is  is 360, then 364.

Viking Global Now Owns 17% of INBX

October 13, 2022

The largest insider transaction on today's list is a Form 4 filing by the Greenwich-based hedge fund Viking Global Investors.

The fund reported a purchase worth roughly $40 million in the small-cap biotech Inhibrx $INBX, increasing its total stake to 17%.

Chart of the Day: Breadth Improvement?

October 13, 2022

In bear markets you tend to get more and more stocks making new lows.

We haven't seen that.

In bull markets you tend to get more and more stocks making new highs.

We haven't seen that either.

So are we going to finally get that expansion in the new lows list?

Or are these meaningful divergences?

All Star Charts Premium,
2 to 100 Club

2 to 100 Club (10-12-2022)

October 12, 2022

From the desk of Steve Strazza @Sstrazza

Welcome to the 2 to 100 Club.

As many of you know, something we've been working on internally is using various bottom-up tools and scans to complement our top-down approach. It's really been working for us!

One way we're doing this is by identifying the strongest growth stocks as they climb the market-cap ladder from small- to mid- to large- and, ultimately, to mega-cap status (over $200B).

Once they graduate from small-cap to mid-cap status (over $2B), they come on our radar. Likewise, when they surpass the roughly $30B mark, they roll off our list.

But the scan doesn't just end there.

We only want to look at the strongest growth industries in the market, as that is typically where these potential 50-baggers come from.

Some of the best performers in recent decades – stocks like Priceline, Amazon, Netflix, Salesforce, and a myriad of others – would have been on this list at some point during their...