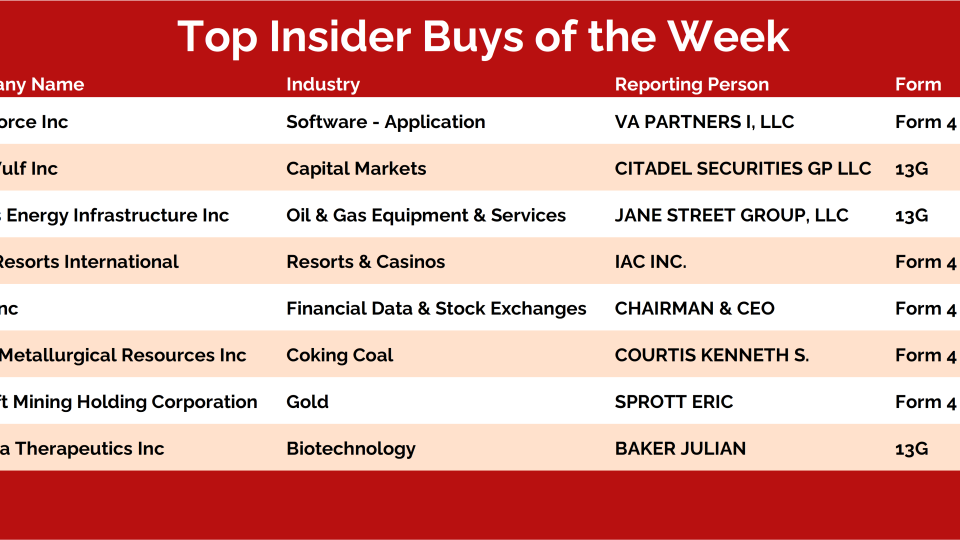
In high school, I wasn't into sports, drinking, or other normal teenage shenanigans.
As strange as it may seem, I was super passionate about technical analysis. I would use my English periods and lunch times learning fixated on what these charts meant, reading countless blogs, and spending hours learning what technical analysis was on Investopedia.
It's hilarious looking back on it now, but I vividly remember my 16th birthday. I convinced my Dad to buy me a flight to Auckland, so I could go to an investing seminar held by a well-known Kiwi entrepreneur, Jamie Beaton.
What teenager wants tickets for an investing seminar for their 16th birthday?
One story you'll hear often from technicians is that technical analysis opened up finance to them in an intuitive way. No longer were they basing their decisions on arbitrary discounted cash flow models or unreliable accounting figures.
Instead, they were following the only driver that moves markets -- money flow.
As I've grown over the years, I've come to a similar conclusion.
We debuted a new scan recently which goes by the name- All Star Momentum.
All Star Momentum is a brand new scan that guides us towards the very best stocks in the market. We have incorporated our stock universe of Nifty 500 as the base this time around. Among the 500 stocks that we follow, this scan will pump out names that are most likely to outperform the market.
Key Takeaway: In recent weeks, the bulls have made their presence known after hiding in the shadows for most of the year. But as they inch their way forward, they will need assurance from the market that they’re moving in the right direction. So far, any signs of positive feedback have been lacking. New lows remain greater than new highs (for 35 weeks and counting). And there is an absence of strength among global markets, although they have stopped going down. The market needs to turn it up in regards to price and participation if the bulls are to prove more than a bunch of wallflowers.
Sentiment Report Chart of the Week: How Do We Keep The Bulls On Dance Floor?
If we are going to have a party, we need to keep bulls on the dance floor. One way to do that is through improved price action. We know that it takes bulls to have a bull market, but it also takes a bull market to keep the bulls involved. When we look across various assets, we keep coming back to key levels...
There's no denying the fact that it's been a rough time being a crypto investor lately.
From our work, crypto market participants are closely approaching their maximum pain thresholds.
In real terms, losses realized on-chain reached their highest values going back to 2011. In nominal terms, Bitcoin holders realized the most amount of losses in USD terms in crypto's entire history.
We've gone from 95% of all market participants holding unrealized profits to a measly 50% in the space of a few short quarters.
This is, by most measures, one of the most severe bear markets by loss realization, capital leaving the ecosystem, and contagion among even the largest and most sophisticated of players.
Despite this destruction of wealth, it's important to be grateful for our losses.
But before you step up to the line to place your bet, you must have a plan – a set of rules rooted in risk management to guide you through your trade.
There’s no way to enter and manage a trade if you don’t know where you’re right, where you’re wrong, and where you’re taking profits. Without a plan, your strategy and philosophical approach to the markets don’t matter.
That brings us to the British pound.
Here’s a chart of the GBP/USD cross:
A few weeks ago, we outlined a short setup in the GBP/USD pair. The pound was breaking down to levels associated with the Brexit sell-off, and we wanted to ride that trend lower.
Around the same time, the EUR/USD reached parity, as the US Dollar Index $DXY hit its highest level since November 2002. "Long dollar, short everything else" was the trade.
But now that the GBP/USD is back above our risk level around 1.2025, we can’t...
It’s been over a month since the S&P 500 made a new year-to-date low and market volatility has cooled somewhat. After averaging a 1% move (in either direction) every other day in the first half of the year, the S&P 500 has only had 5 such moves so far in July (16 trading days). The last one was over a week ago.
A couple 9-to-1 up volume days on the NYSE and an uptick in bulls on the sentiment surveys is providing some hope that the bear market environment may be fading. Our Risk Indicators (as well as the continued presence of more stocks making new lows than new highs) argue that it is premature to jump to that conclusion.
We have seen some improvement over the past month, and of the 20 risk off - risk on asset pairs, 14 are closer to their risk-on extreme than they were a month ago. But even with that improvement, only 3 of the pairs are closer to the risk-extreme than the risk-off extreme. In this fight over field position team “Risk Off” is winning. As we get into the details, this story is more about a lack of risk appetite and risk on weakness rather than broad...
And, just like that, any residual strength in crypto has once again dwindled.
Guys, we like to keep it honest and real with you.
At a certain point, we feel obnoxious about being so repetitive. But we're not going to tell you anything other than what's happening -- it's just our job as technicians to follow the money flow.
In yesterday's note, we outlined how we were taking a small, low-conviction long if Bitcoin $BTC was above 22,000. Just one day after we put the position on, Bitcoin's fallen back into its range:
The largest insider transaction on today’s list is a Form 4 filing by Director Lorence H. Kim, who reported a purchase of roughly $1 million in Revolution Medicines $RVMD.