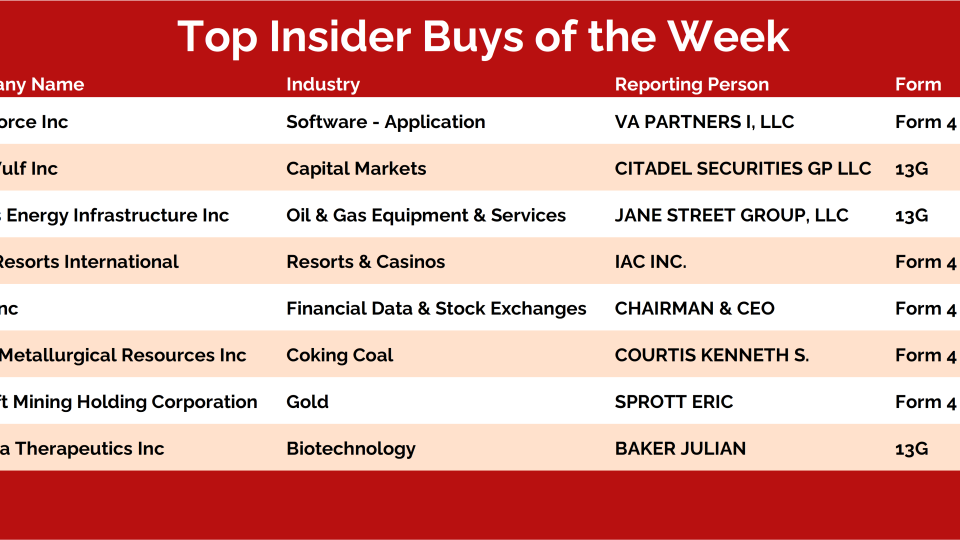
Higher bond yields are adding market volatility but not financial stress.
Key to last week’s shift in the weight of the evidence from bullish to neutral was the continued deterioration in breadth trends, especially in the US. On everything except the shortest of time frames we continue to see more new lows than new highs. Over the past two months, there have only been two trading days on which the...
But also notice how we've been seeing more strength around the world, with the US acting as one of the laggards. It probably has something to do with all that growth exposure in a lot of US large-cap indexes.
Most other countries don't have that.
Here you can see the Dow Jones Composite Index holding that key 11,200 area. This is a good representation of what we're seeing in a lot of other major indexes and sectors:
In this weekly note, we highlight 10 of the most important charts or themes we're currently seeing in asset classes around the world.
Rates Spike Around The Globe
Interest rates are on the rise, and it’s not just in the US and Europe. The Japanese 10-year yield hit its highest level in over five years last week. Like Germany, Japan is now back in positive territory after a half-decade of offering negative yields. All of this action is supportive of the new highs we’re seeing from the US 10-year yield. With rates on the rise around the world and the question turning into “how high” – as opposed to “if” – the FED will hike, it’s time to look for opportunities in the areas of the market that benefit the most from a rising rate environment.
Check out this week's Momentum Report, our weekly summation of all the major indexes at a Macro, International, Sector, and Industry Group level.
By analyzing the short-term data in these reports, we get a more tactical view of the current state of markets. This information then helps us put near-term developments into the big picture context and provides insights regarding the structural trends at play.
Let's jump right into it with some of the major takeaways from this week's report:
* ASC Plus Members can access the Momentum Report by clicking the link at the bottom of this post.
Macro Universe:
Our macro universe was green this week, as 72% of our list closed higher with a median return of 1.53%.
This week, US 10-Year Yield $TNX was the winner, closing with an 8.31% gain.
The biggest loser was the Volatility Index $VIX, with a loss of -16.05%.
There was a 2% drop in the percentage of assets on our list within 5% of their 52-week highs – currently at 28%.
13% of our macro list made fresh 4-week highs, 11...
I love when the team feels a little "frisky" and hunts for "speculative" ideas. There's nothing that gets the creative juices flowing more than getting outside the wheelhouse a bit, looking for new experiences.
This lead them down the path of picking through the wreckage in Chinese stocks.
In the recent Monthly Candles Strategy session (find the charts here), JC highlighted a couple names in China that are offering speculative opportunities for those willing to step boldly where most bulls are too sheepish to look.
As options traders, we too can join the party. But we can minimize the risk better while still participating if the speculators have their way.
In last week's report, we outlined a handful of bullish developments appearing as we waited for price action to respond.
We discussed the fact that the institutional money that left in October is flowing back, exchanges are seeing modest outflows, and traditional markets are looking prime for a tactical bounce.
Since then, we've seen Bitcoin rally to our inflection point between 41,000 and 42,000.
With momentum turning back in the favor of the bulls, the highest-likelihood scenario looks to be a few weeks of sideways price action ahead of further upside follow-through.
This week I had a great conversation with Jeremy Schwartz on the Behind The Markets Podcast on SiriusXM Radio.
Jeremy and I have been through a few cycles throughout our careers and probably understand the weightings of Indexes and ETFs better than most investors. Which was a big point I was trying to make: Understand what you own. You need to know what's inside of these things, and more importantly, what's not.
There's a lot going on in today's market but I tried to really focus in on the primary trends and where I think we're going this year.
Last time we did this I got to go down to the studio at the Wharton School at the University of Pennsylvania. But the weather was bad so we recorded remotely. Hopefully I can make it down there soon and we can do it live from the University once again.
Either way, I think we hit on a bunch of key points on this episode.
For most of my career, I've listened to fundamental analysts make the argument that investors should be overweight international stocks because they're "cheaper" than US stocks.
This has been the case for a long time now, and it's merely a function of the fact that there are far more value and cyclical stocks overseas.
But, since value stocks have been out of favor for so long, ex-US stocks have severely underperformed domestic markets.
Growth has been the place to be for the last decade, and for this reason the alpha has been with the tech-heavy US stock market over its global peers.
But now that we're seeing the tide shift in favor of value, we're also seeing early signs of reversals in the US versus the world relative trends.
There's still more work to be done before we have conviction that we want to favor international stocks, but the weight of the evidence continues to move in that direction.
In today's post, we'll discuss what we're seeing from these relative trends and then go over some areas of the global equity market that are likely to benefit from the value over...
Our International Hall of Famers list is composed of the 100 largest US-listed international stocks, or ADRs. We’ve also sprinkled in some of the largest ADRs from countries that did not make the market-cap cut.
These stocks range from some well-known mega-cap multinationals such as Toyota Motor and Royal Dutch Shell to some large-cap global disruptors such as Sea Ltd and Shopify.
It’s got all the big names and more--but only those that are based outside the US. You can find all the largest US stocks on our original Hall of Famers list.
The beauty of these scans is really in their simplicity.
We take the largest names each week and then apply technical filters in a way that the strongest stocks with the most momentum rise to the top.
Based on the market environment, we can also flip the scan on its head and filter for weakness.
Let’s dive in and take a look at some of the most important stocks from around the world.
By looking at various ratios relative to where they have been over the past year, we get a sense of investor risk appetite from an intermarket perspective. The pairwise comparisons in our risk off - risk on Range-O-Meter show a decisive tilt toward risk off assets over the past month. A few (Staples vs Discretionary, Large-Cap vs Small-Cap, Yen vs Aussie Dollar) are nearing new 52-week extremes favoring the risk-off side of the ratio. We could get some near-term relief from the intense selling of January, some of that has been seen this week already. But if we are seeing broad and sustainable strength, I expect it will be evident by a decisive move toward the risk-on side of our range-o-meter.
I can't pretend to understand the first thing about interest rates, how or why they behave the way they do, nor how their moves in relation to each other mean certain things. Thankfully, I don't need to. I just need to follow price.
And right now, price is signaling loud and clear that we need to take a short position in some of these bond vehicles.
I’ve received a few questions from readers about playing bounces in some oversold stocks.
The most recent was Facebook, er… Meta (whatever).
An opportunistic trader hit me with this question:
Is anybody interested in taking a position in these heavily discounted calls in $FB today?
Discounted? Au contraire, mon frère.
Shares of $FB stock may be “discounted” after getting shellacked to the tune of -26% or so. But there are no discounts to be found anywhere on the options chain.
Dividend Aristocrats are easily some of the most desirable investments on Wall Street.
These are the names that have increased dividends for at least 25 years, providing steadily increasing income to long-term-minded shareholders.
As you can imagine, the companies making up this prestigious list are some of the most recognizable brands in the world. Coca-Cola, Walmart, and Johnson & Johnson are just a few of the household names making the cut.
Here at All Star Charts, we like to stay ahead of the curve.
That's why we're turning our attention to the future aristocrats. In an effort to seek out the next generation of the cream-of-the-crop dividend plays, we're curating a list of stocks that have raised their payouts every year for five to nine years.
We call them the Young Aristocrats, and the idea is that these are "stocks that pay you to make money."
Imagine if years of consistent dividend growth and high momentum and relative strength had a baby, leaving you with the best of the emerging dividend giants that are outperforming the averages.
It’s difficult to stay on top of things if you don’t periodically pause for reflection.
What did you do yesterday that you want to do more of tomorrow? What do you want to do less of tomorrow? Rarely is any single day a make or break situation. But success over time is about leaning into the things that work and leaning away from the things that don’t work.
From an investing perspective, it’s about trusting prices and their trends. This involves tilting toward the parts of the market that are moving higher, while avoiding areas that are moving lower. It’s about avoiding “should” and dealing with “is”. The market is dealing with a negative reaction to disappointing data from several stocks that are in well-established downtrends as I type. That really shouldn’t be that big of a surprise. Stocks making new lows tend to be those in downtrends, while those making new highs tend to be those that are in uptrends. That’s the way the world works.
Last week I mentioned ordering seeds and starting to plan the summer garden. In addition to taking stock of what we had left from last year, we also had to...
One of your close friends asks you about technical analysis. What do technicians do? "What even is technical analysis?" they ask.
Your first instinct is to dive down the rabbit hole of charts, indicators, and intermarket analysis. After your rambling, your friend is even more confused than before they asked.
That's the common mistake, one of the primary reasons why technical analysis often gets such a bad rap.
In the same way you wouldn't describe geography as the study of seismometers or biology as the field of microscopes, you'd be selling technical analysis short by arguing it's the study of indicators.