If you trade options, you know that expiration day can be a wild ride. Some trades go exactly as planned, while others take an unexpected turn—like waking up to an assignment you weren’t expecting.
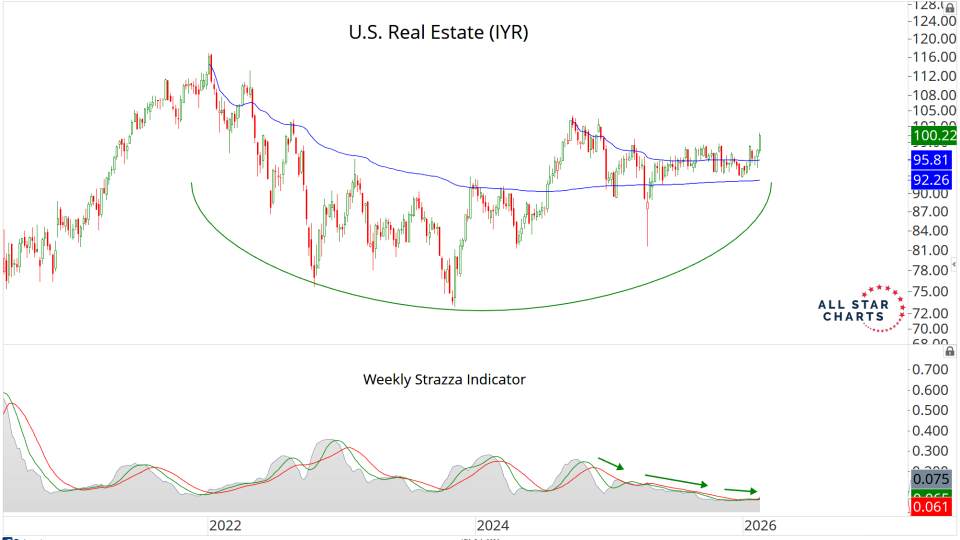
As more stocks, more sectors and more countries around the world start to participate in this bull market, any of the short sellers who overstayed their welcome are getting blown up.
Good.
This is a classic characteristic of healthy bull...
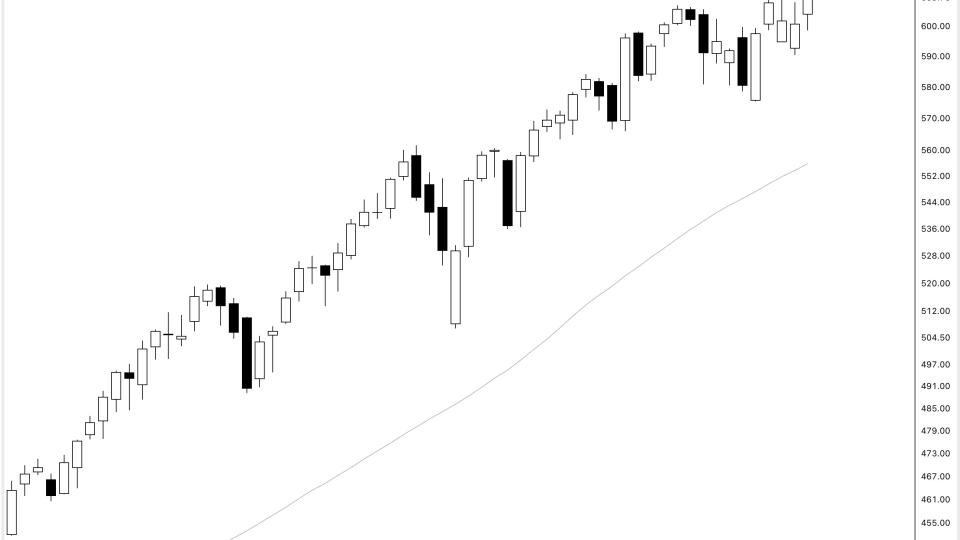
Bearish market sentiment continues to rise, with our Average Bears indicator reaching 38.8 last week. Meanwhile, the S&P 500 index achieved a weekly all-time high...
The altcoin space just got obliterated.Traders have been liquidated en masse, and bullish positioning has been wiped clean. By definition, pessimism now outweighs optimism.But if you've been following along, you know I spent months neutral on crypto....